Hans Zimmer's OST vs Original Film
A Data Visualization Project based on the Seattle Public Library DatasetDate: Mar 2018
Categories: Data Visualization
Categories: Data Visualization
Some movies have reputations in terms of music, in other words, original soundtracks (OST) of a film. In this regard, comparing the popularity of a film with the popularity of its OST could be interesting. To narrow down a data range, I decided to focus on the works of Hans Zimmer, who is a renowned film composer and has received a range of honors and awards, and compare the checkouts of OSTs, in which Hans participated or composed, and the checkouts of their original films from the Seattle Public Library dataset.
Initial 2D Visualization
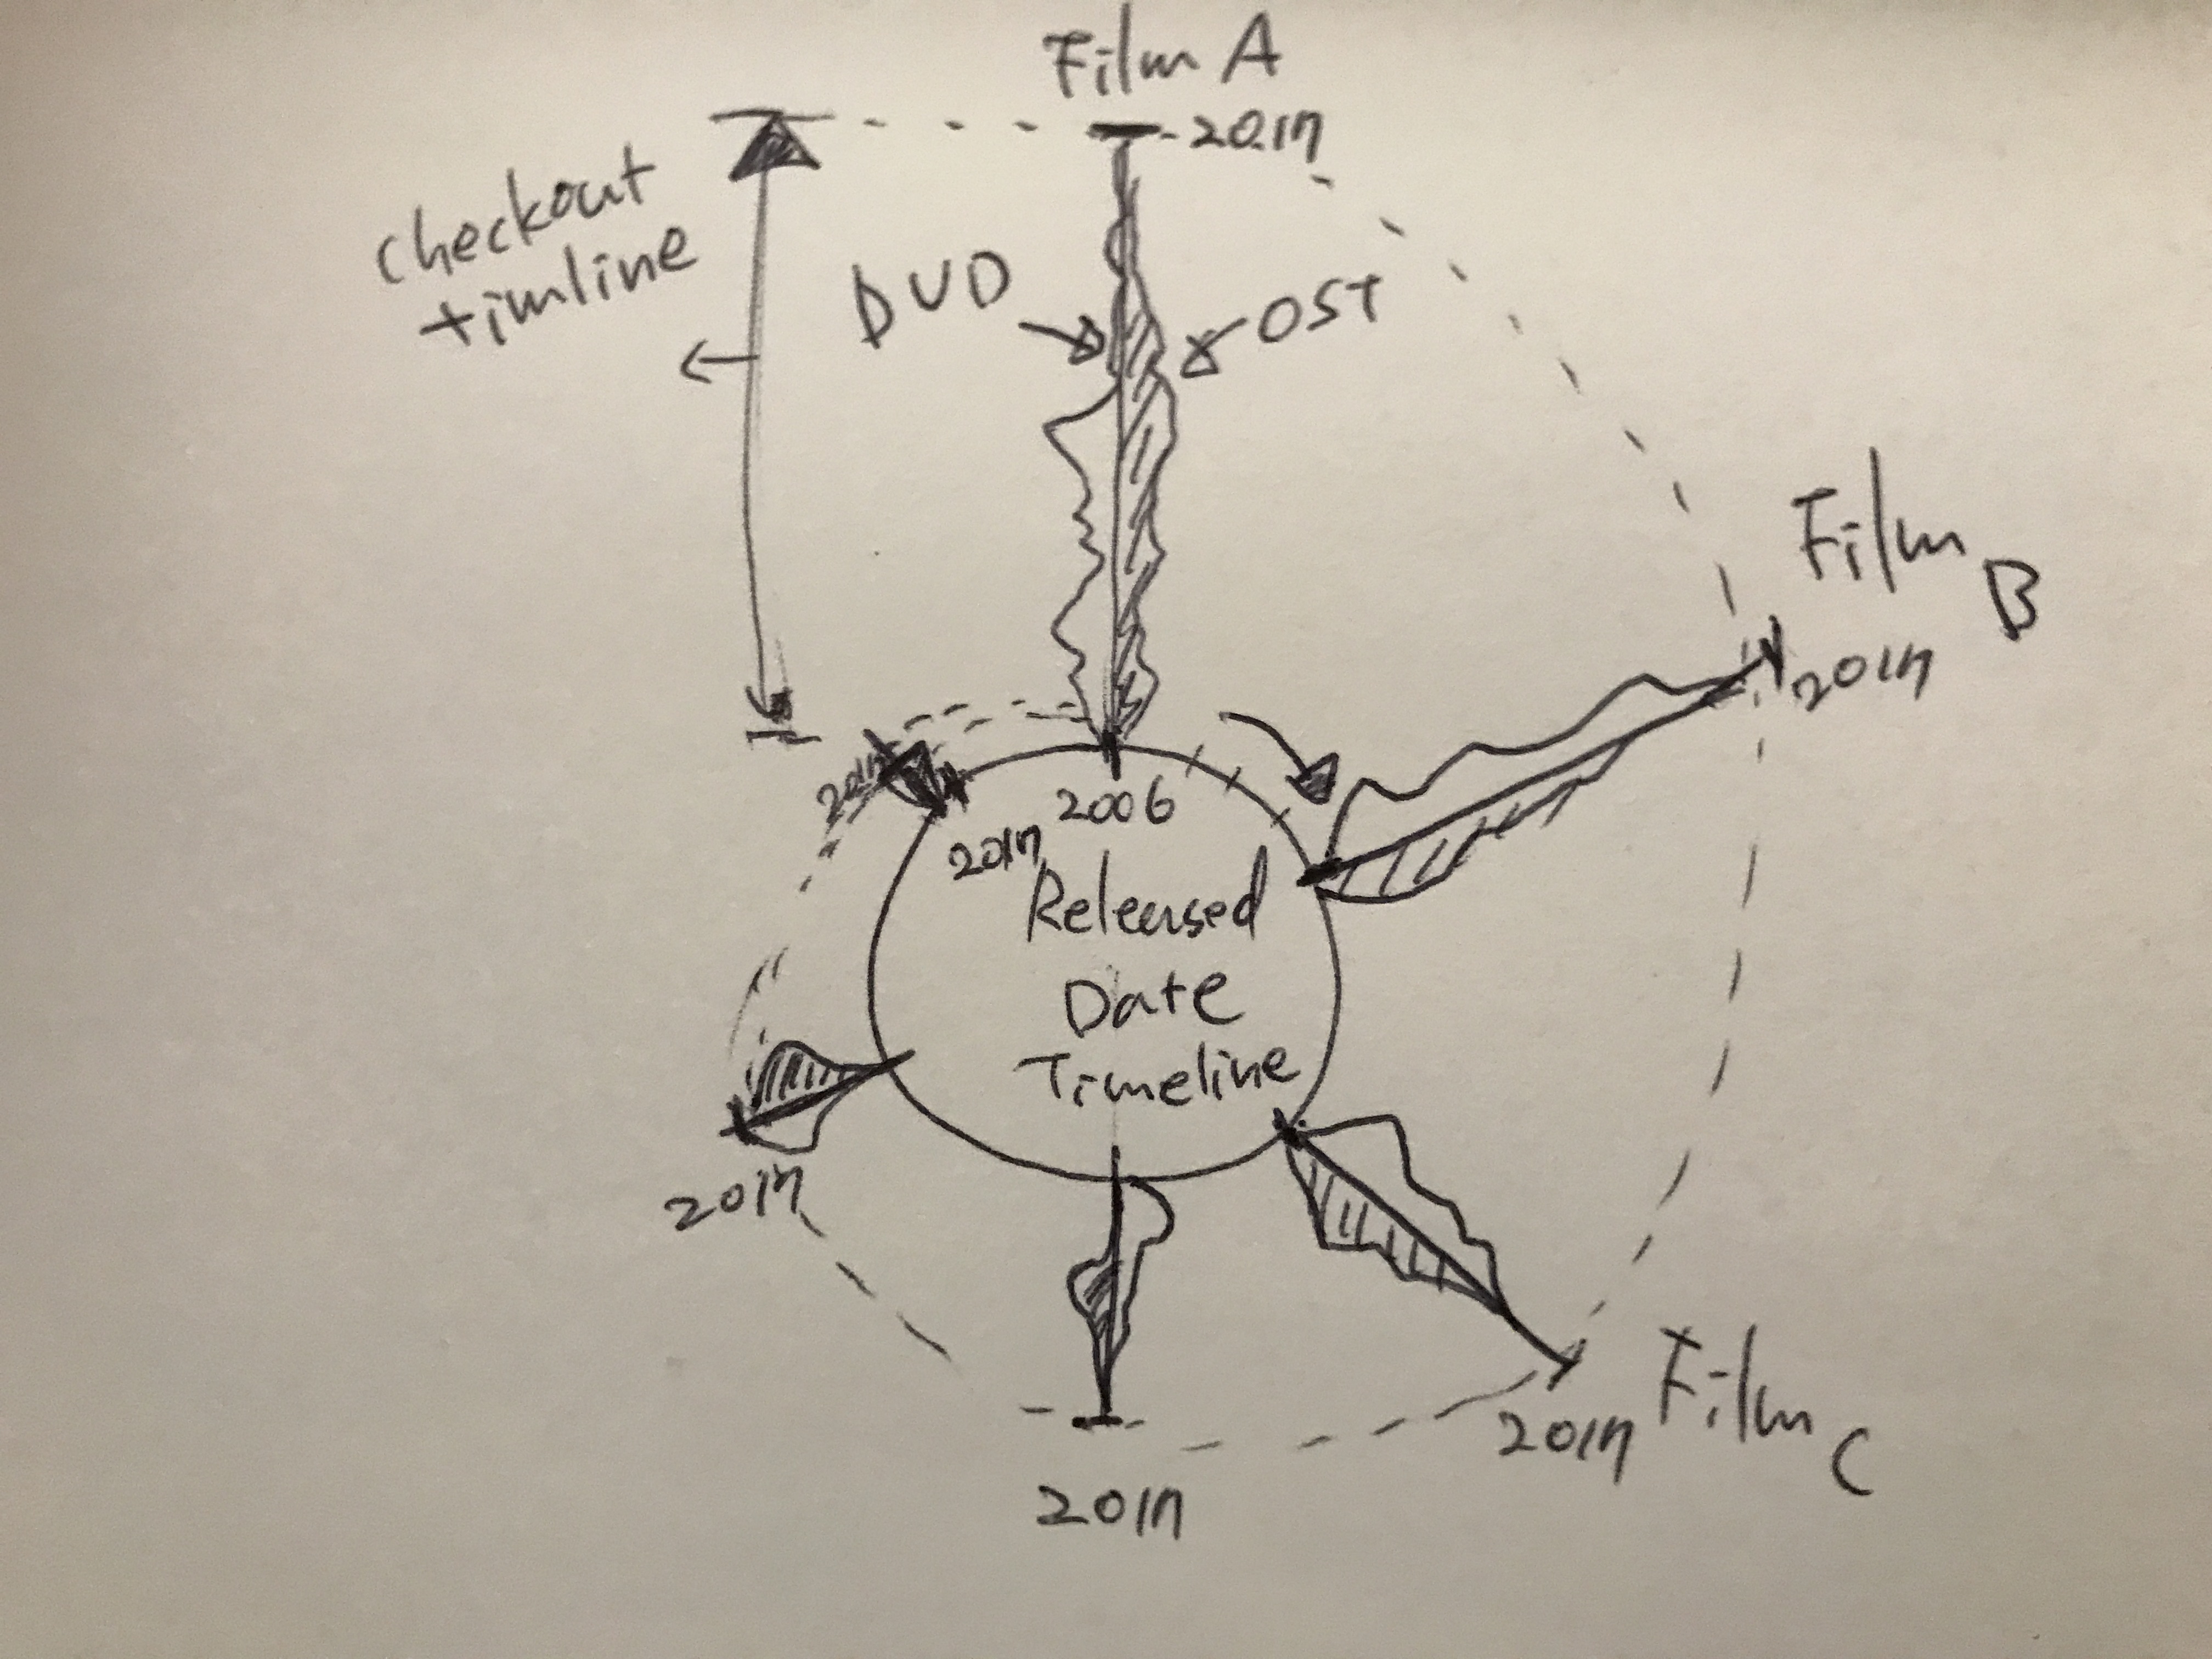
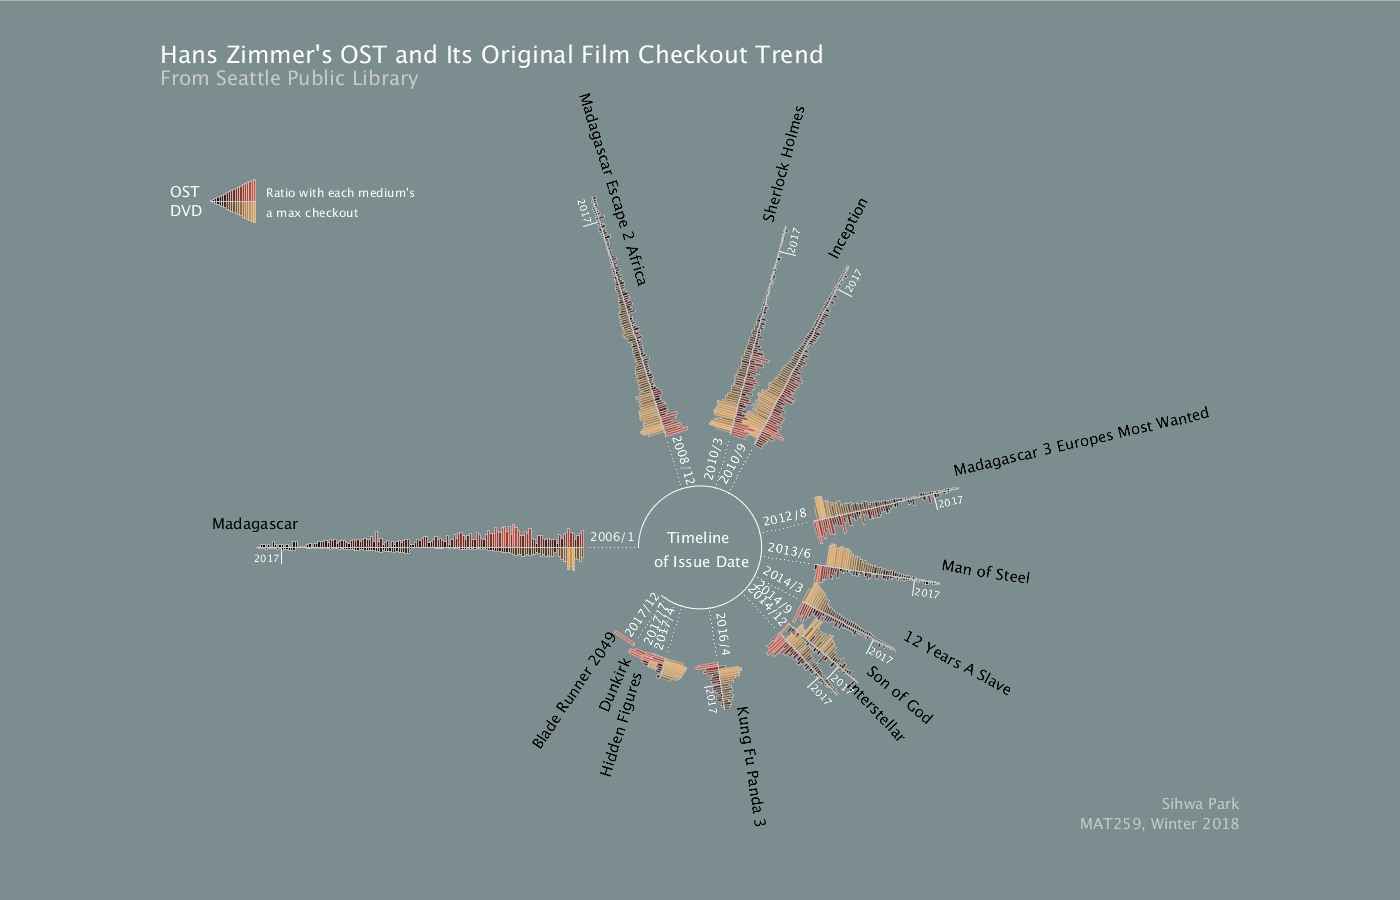
The main visual concept is to combine a circular timeline of an item's release date with a linear timeline of an item's checkout. This is because my main purpose in visualization is to see the trend of checkouts not its amount in detail since an item is issued and to compare the trend of two items, the OST and DVD of a film. For comparing two items, OST's trend is flipped in terms of the y-axis of a linear timeline, in other words, values reflecting checkouts, and placed DVD and OST's data together along with the x-axis of a linear timeline. And a film's checkout timeline starts at a certain point of a circular timeline which means the earliest released date among the film's OST and DVD. The length of an arc from the point of a released date to the end of a circular timeline is the same with the length of each film's linear timeline from the point.
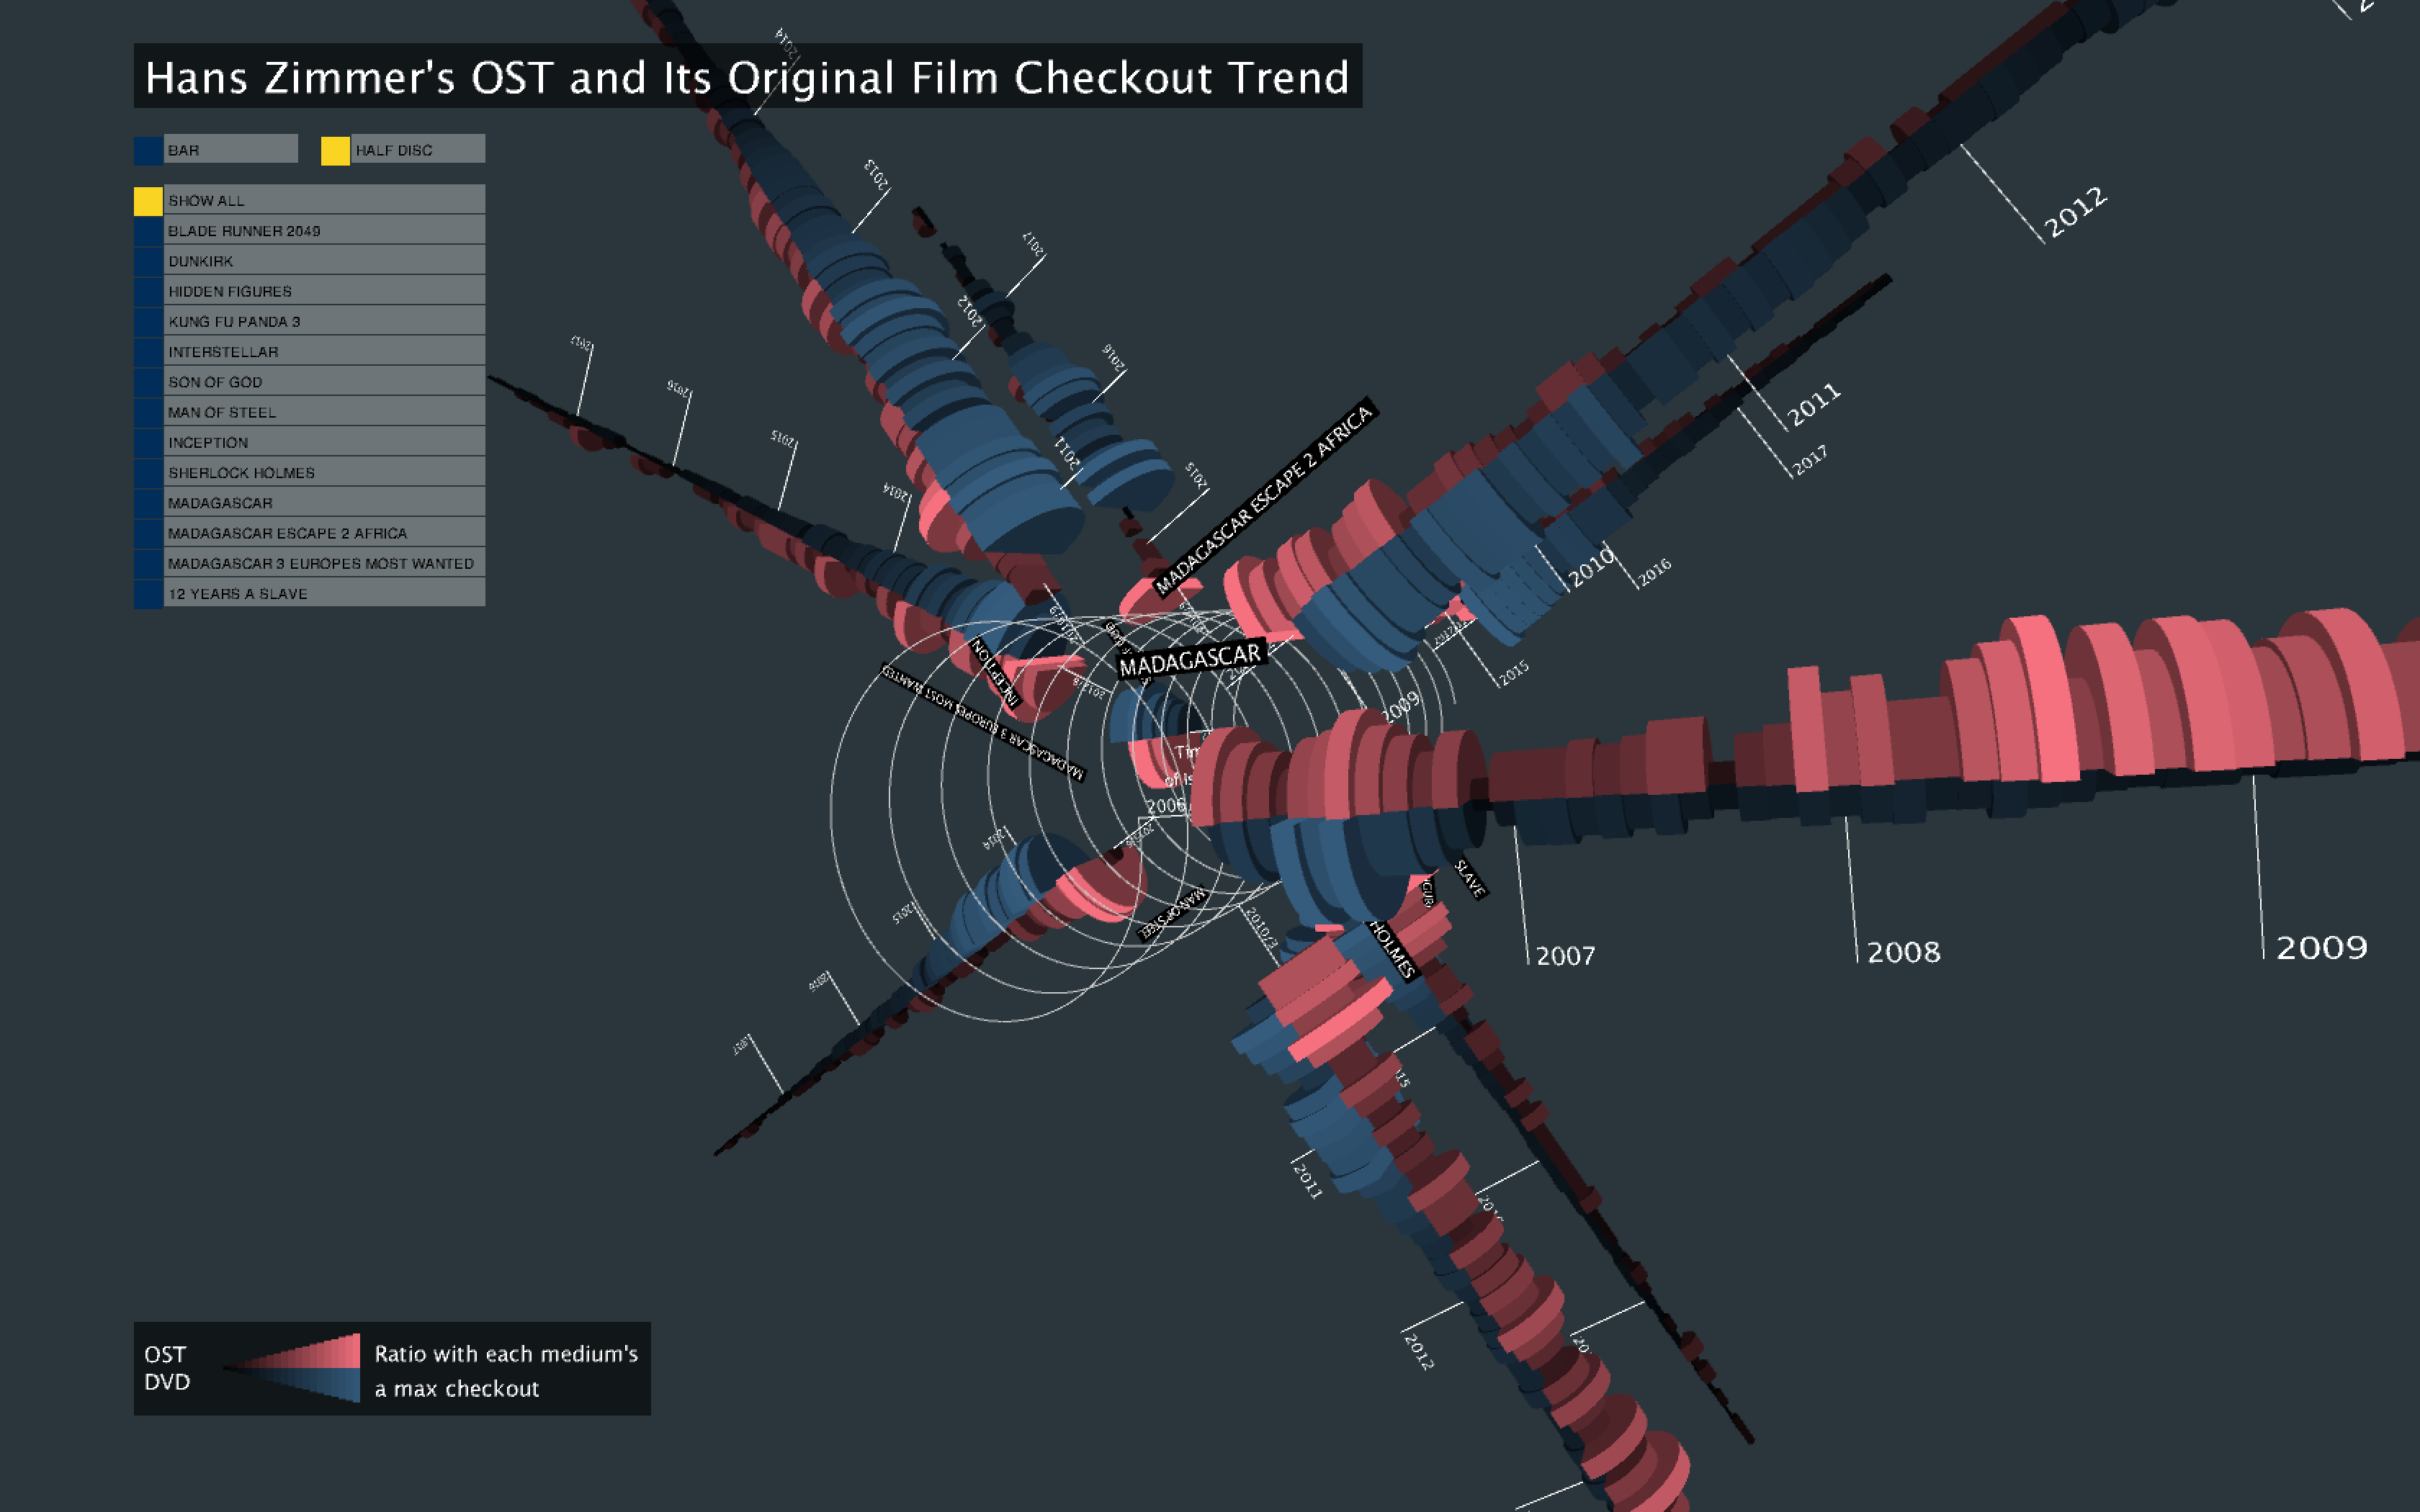
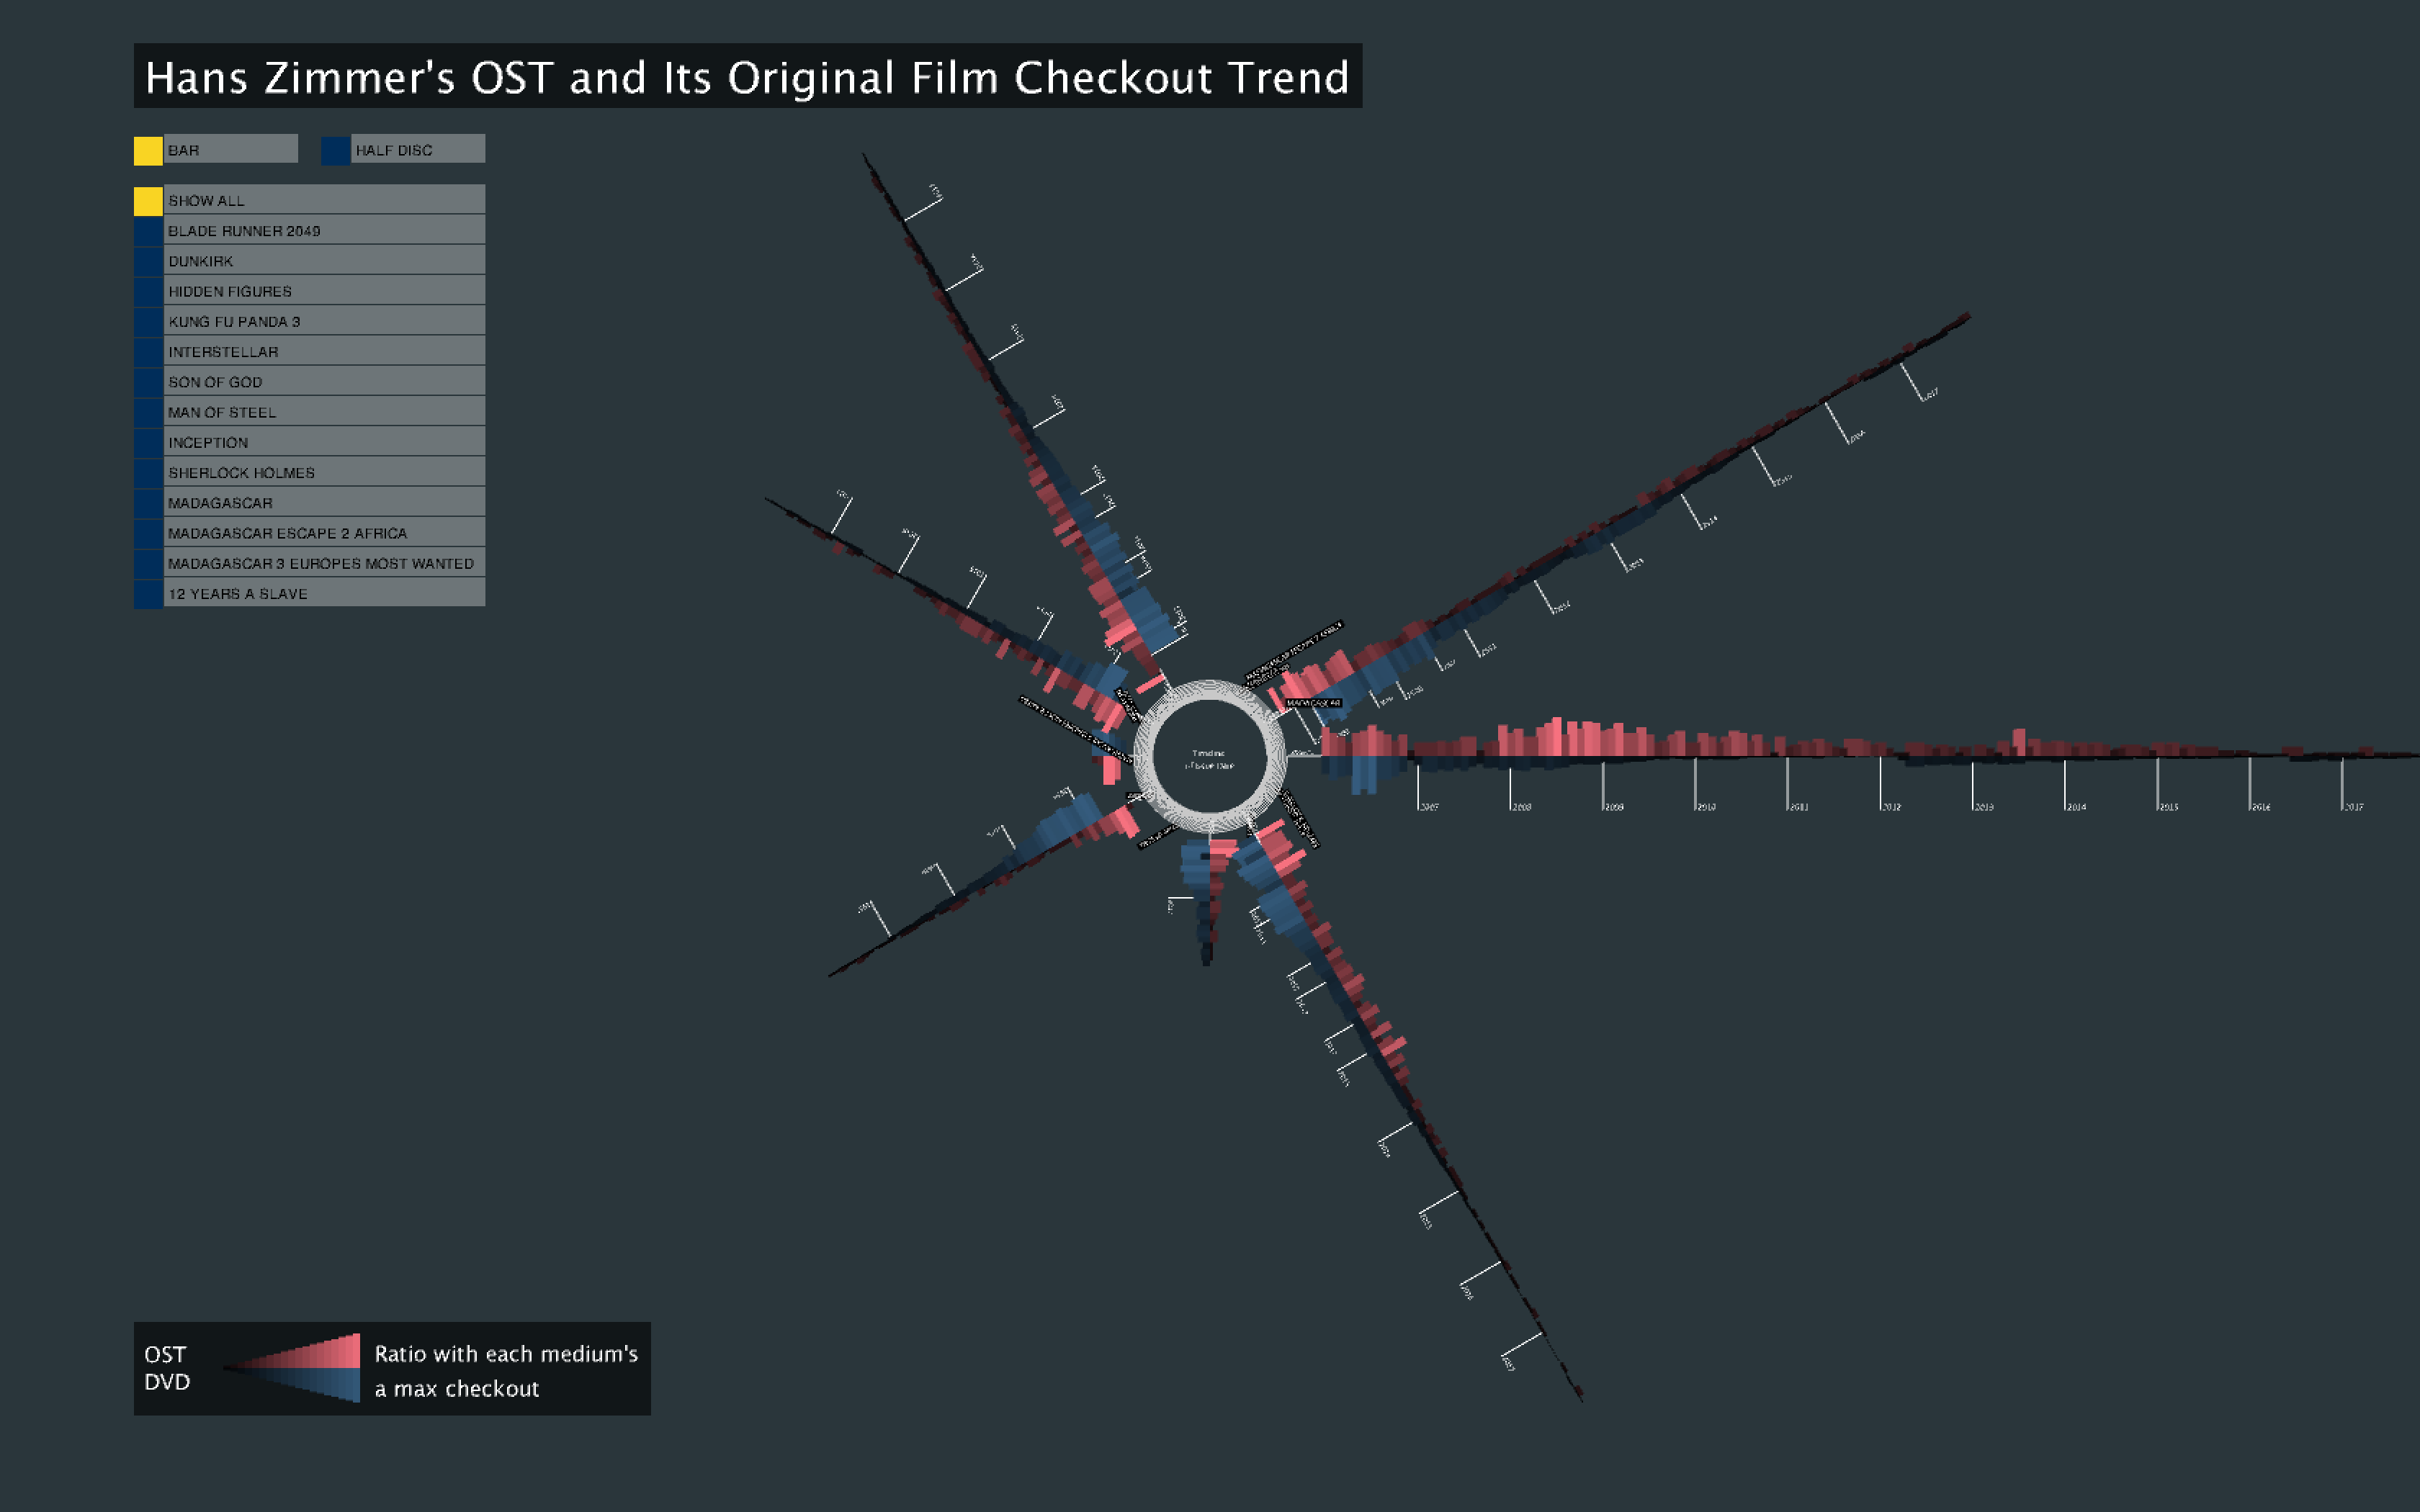
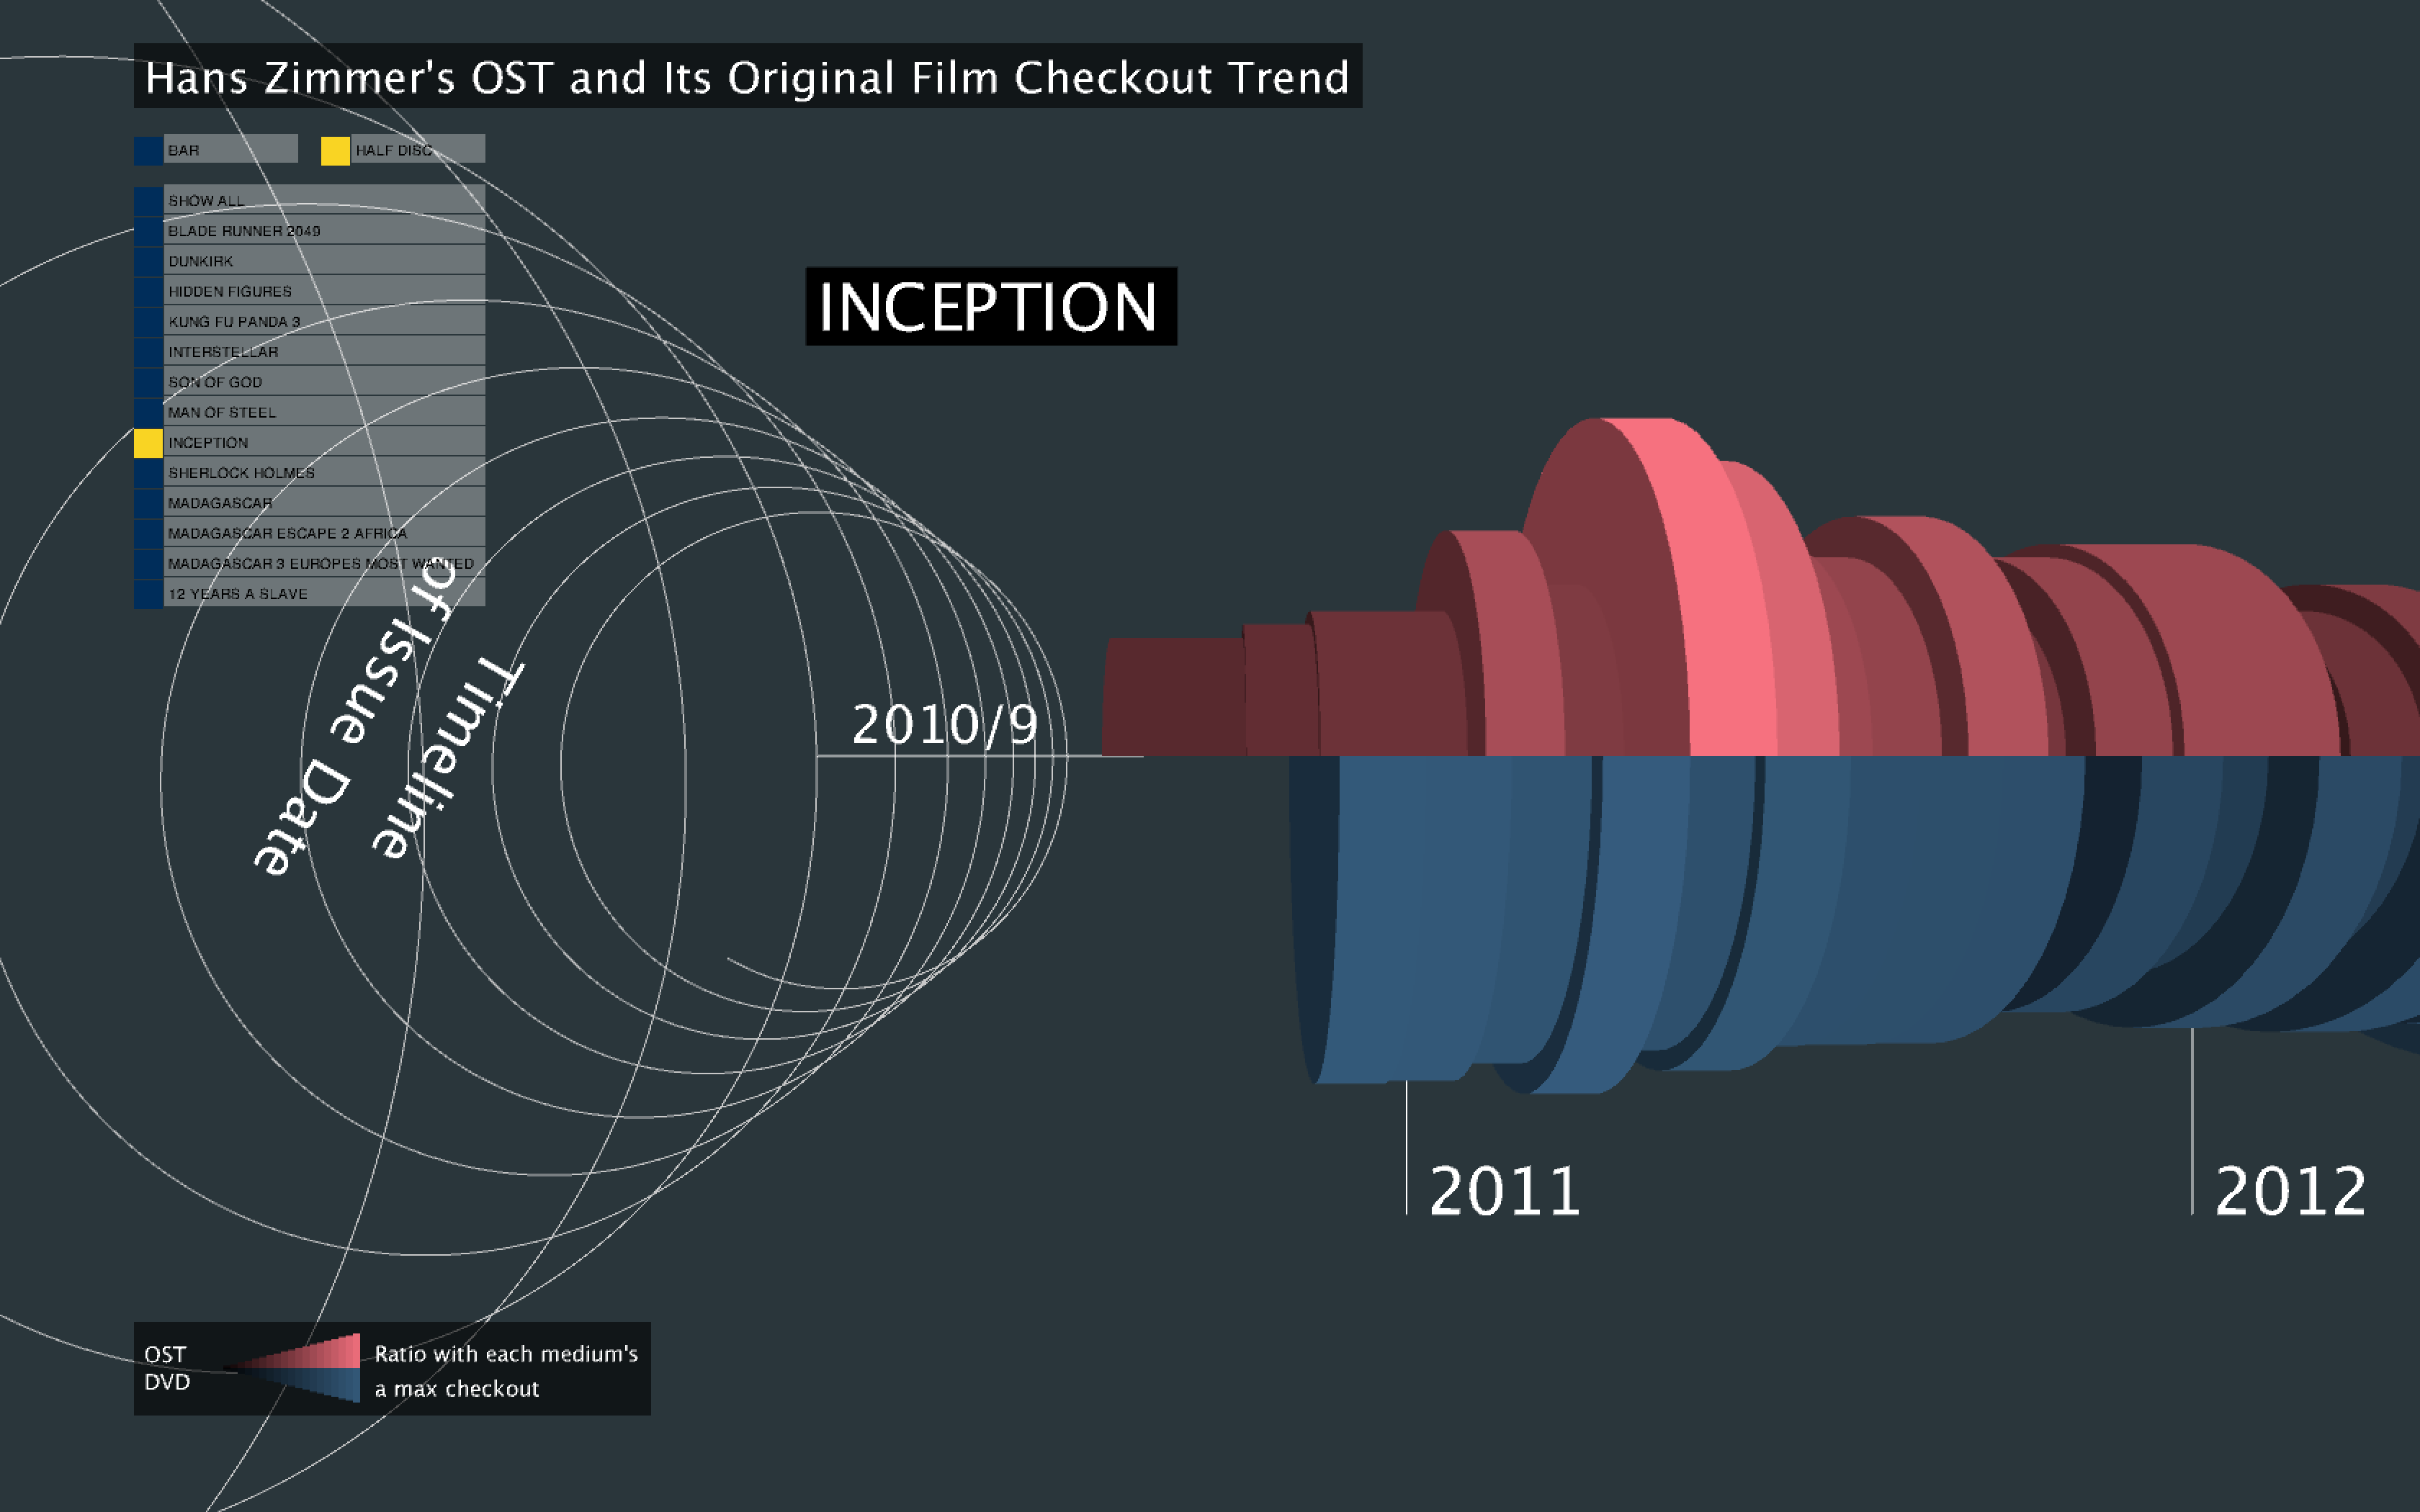
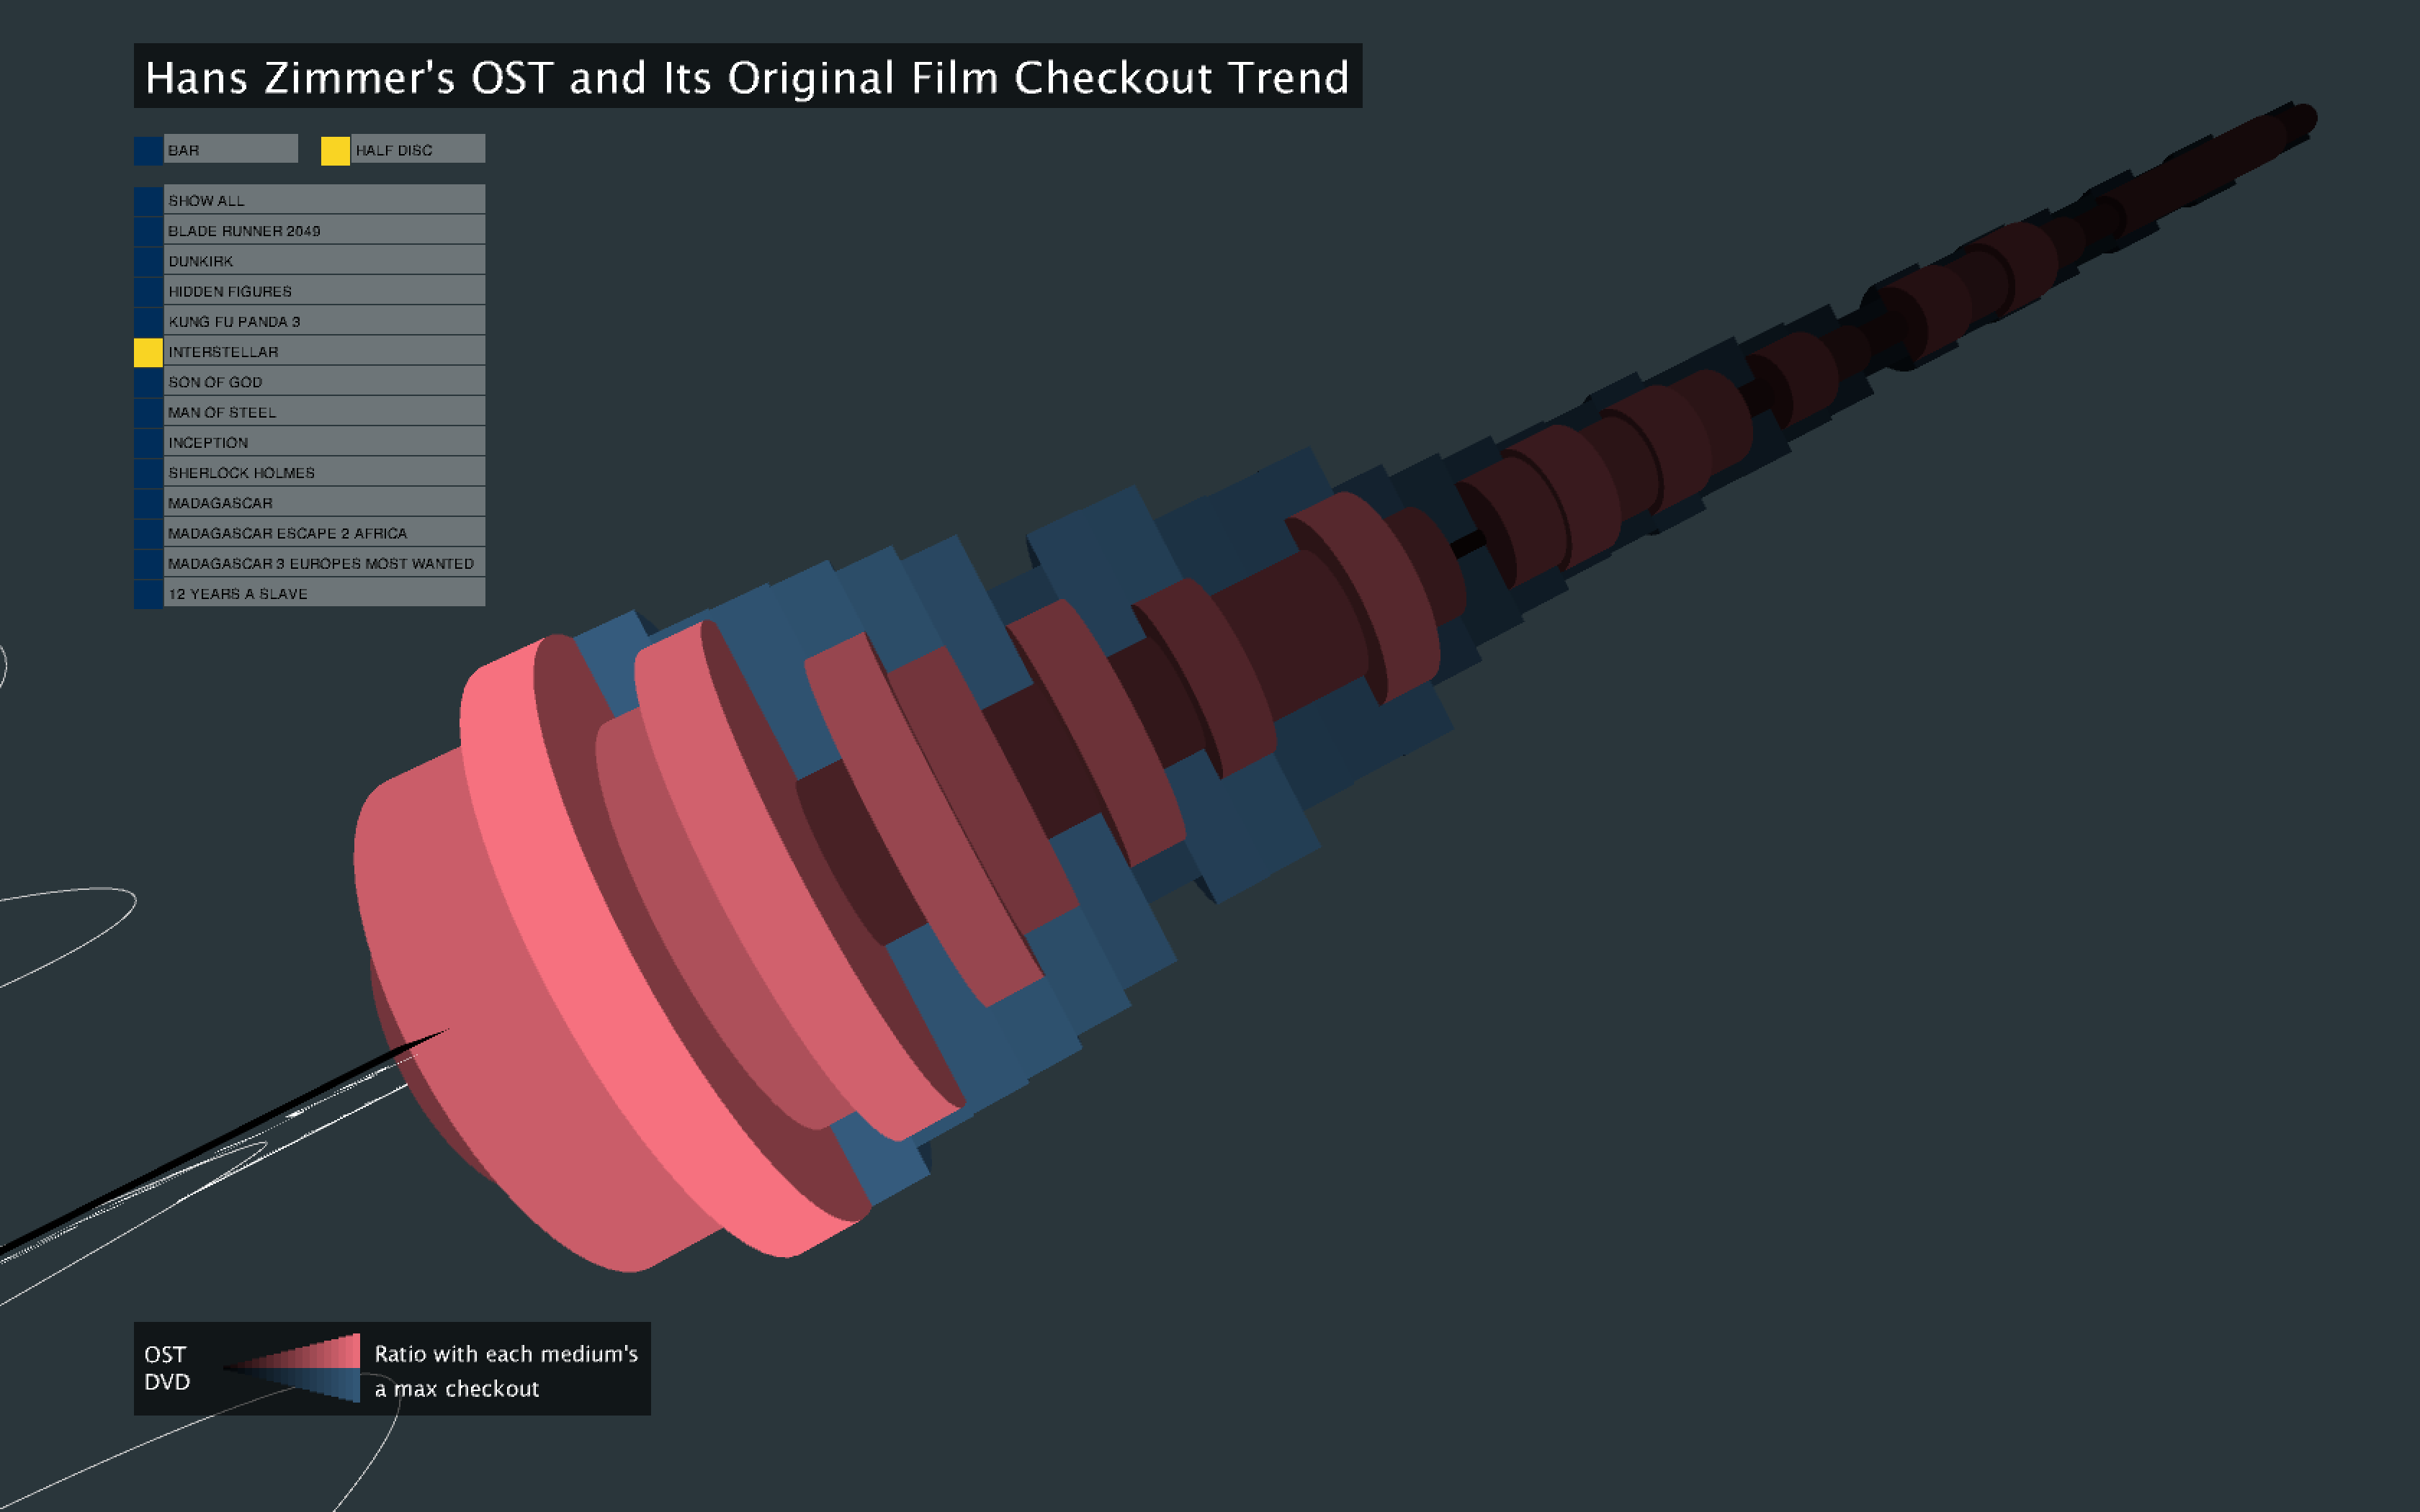
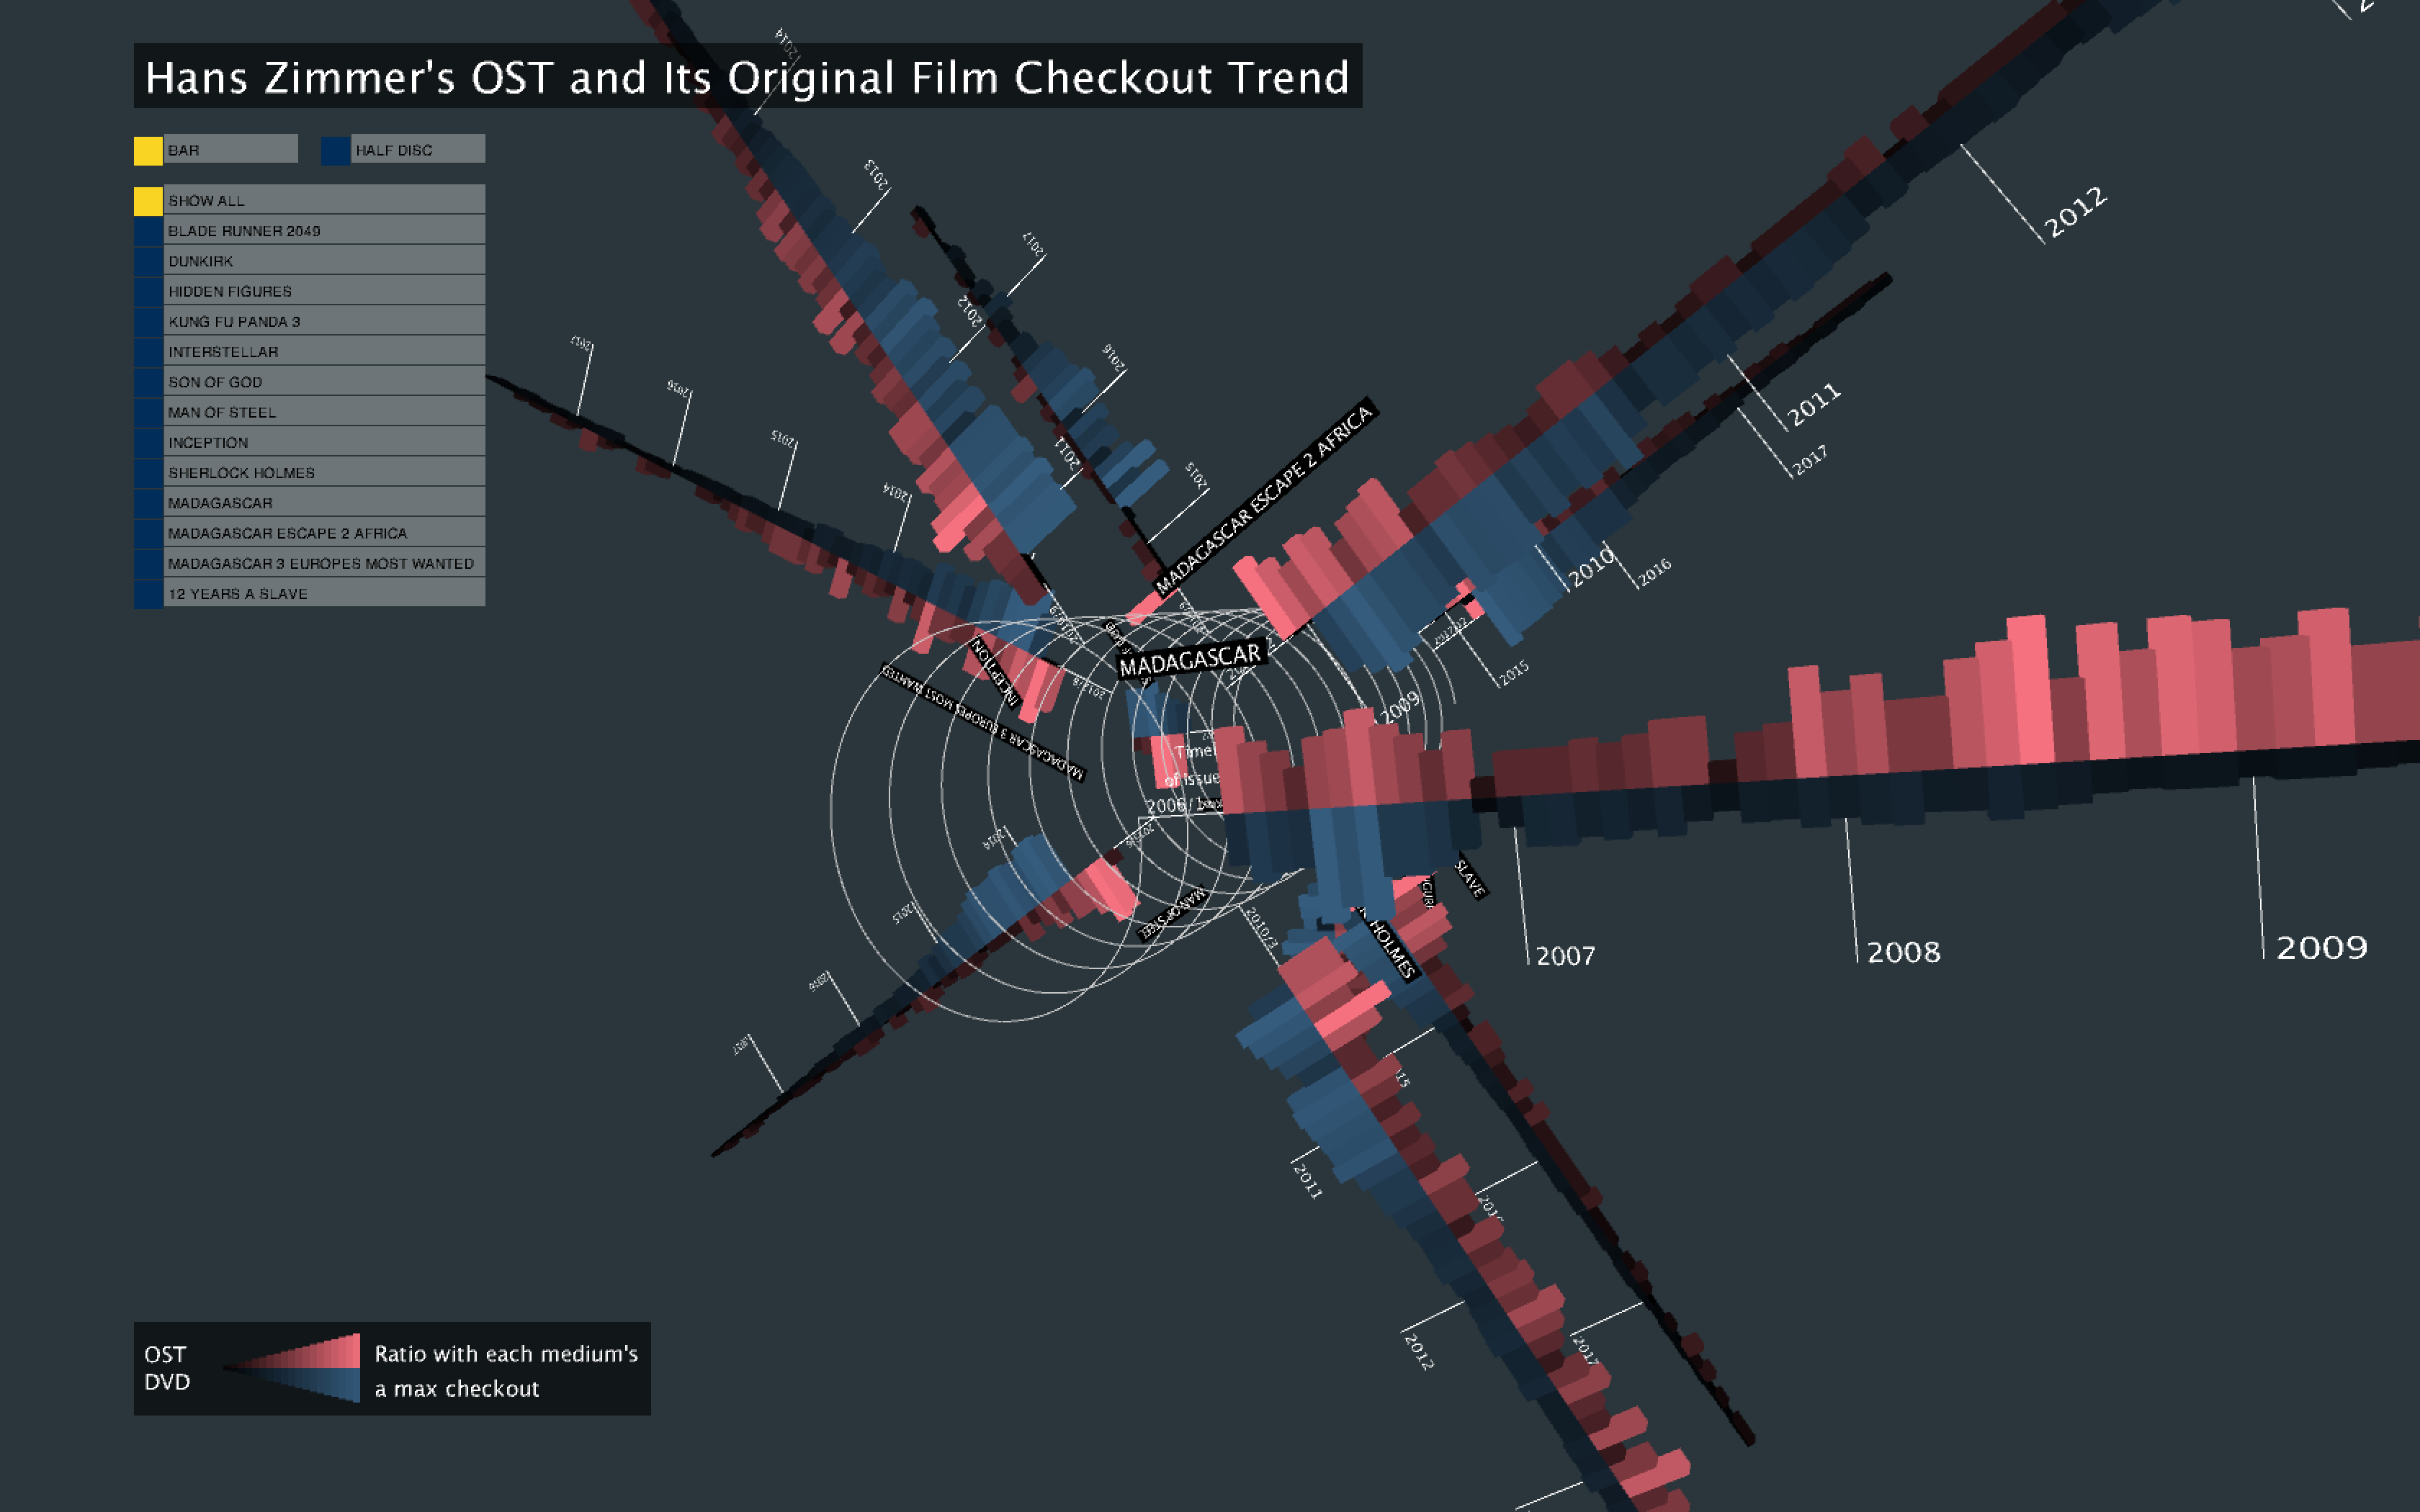
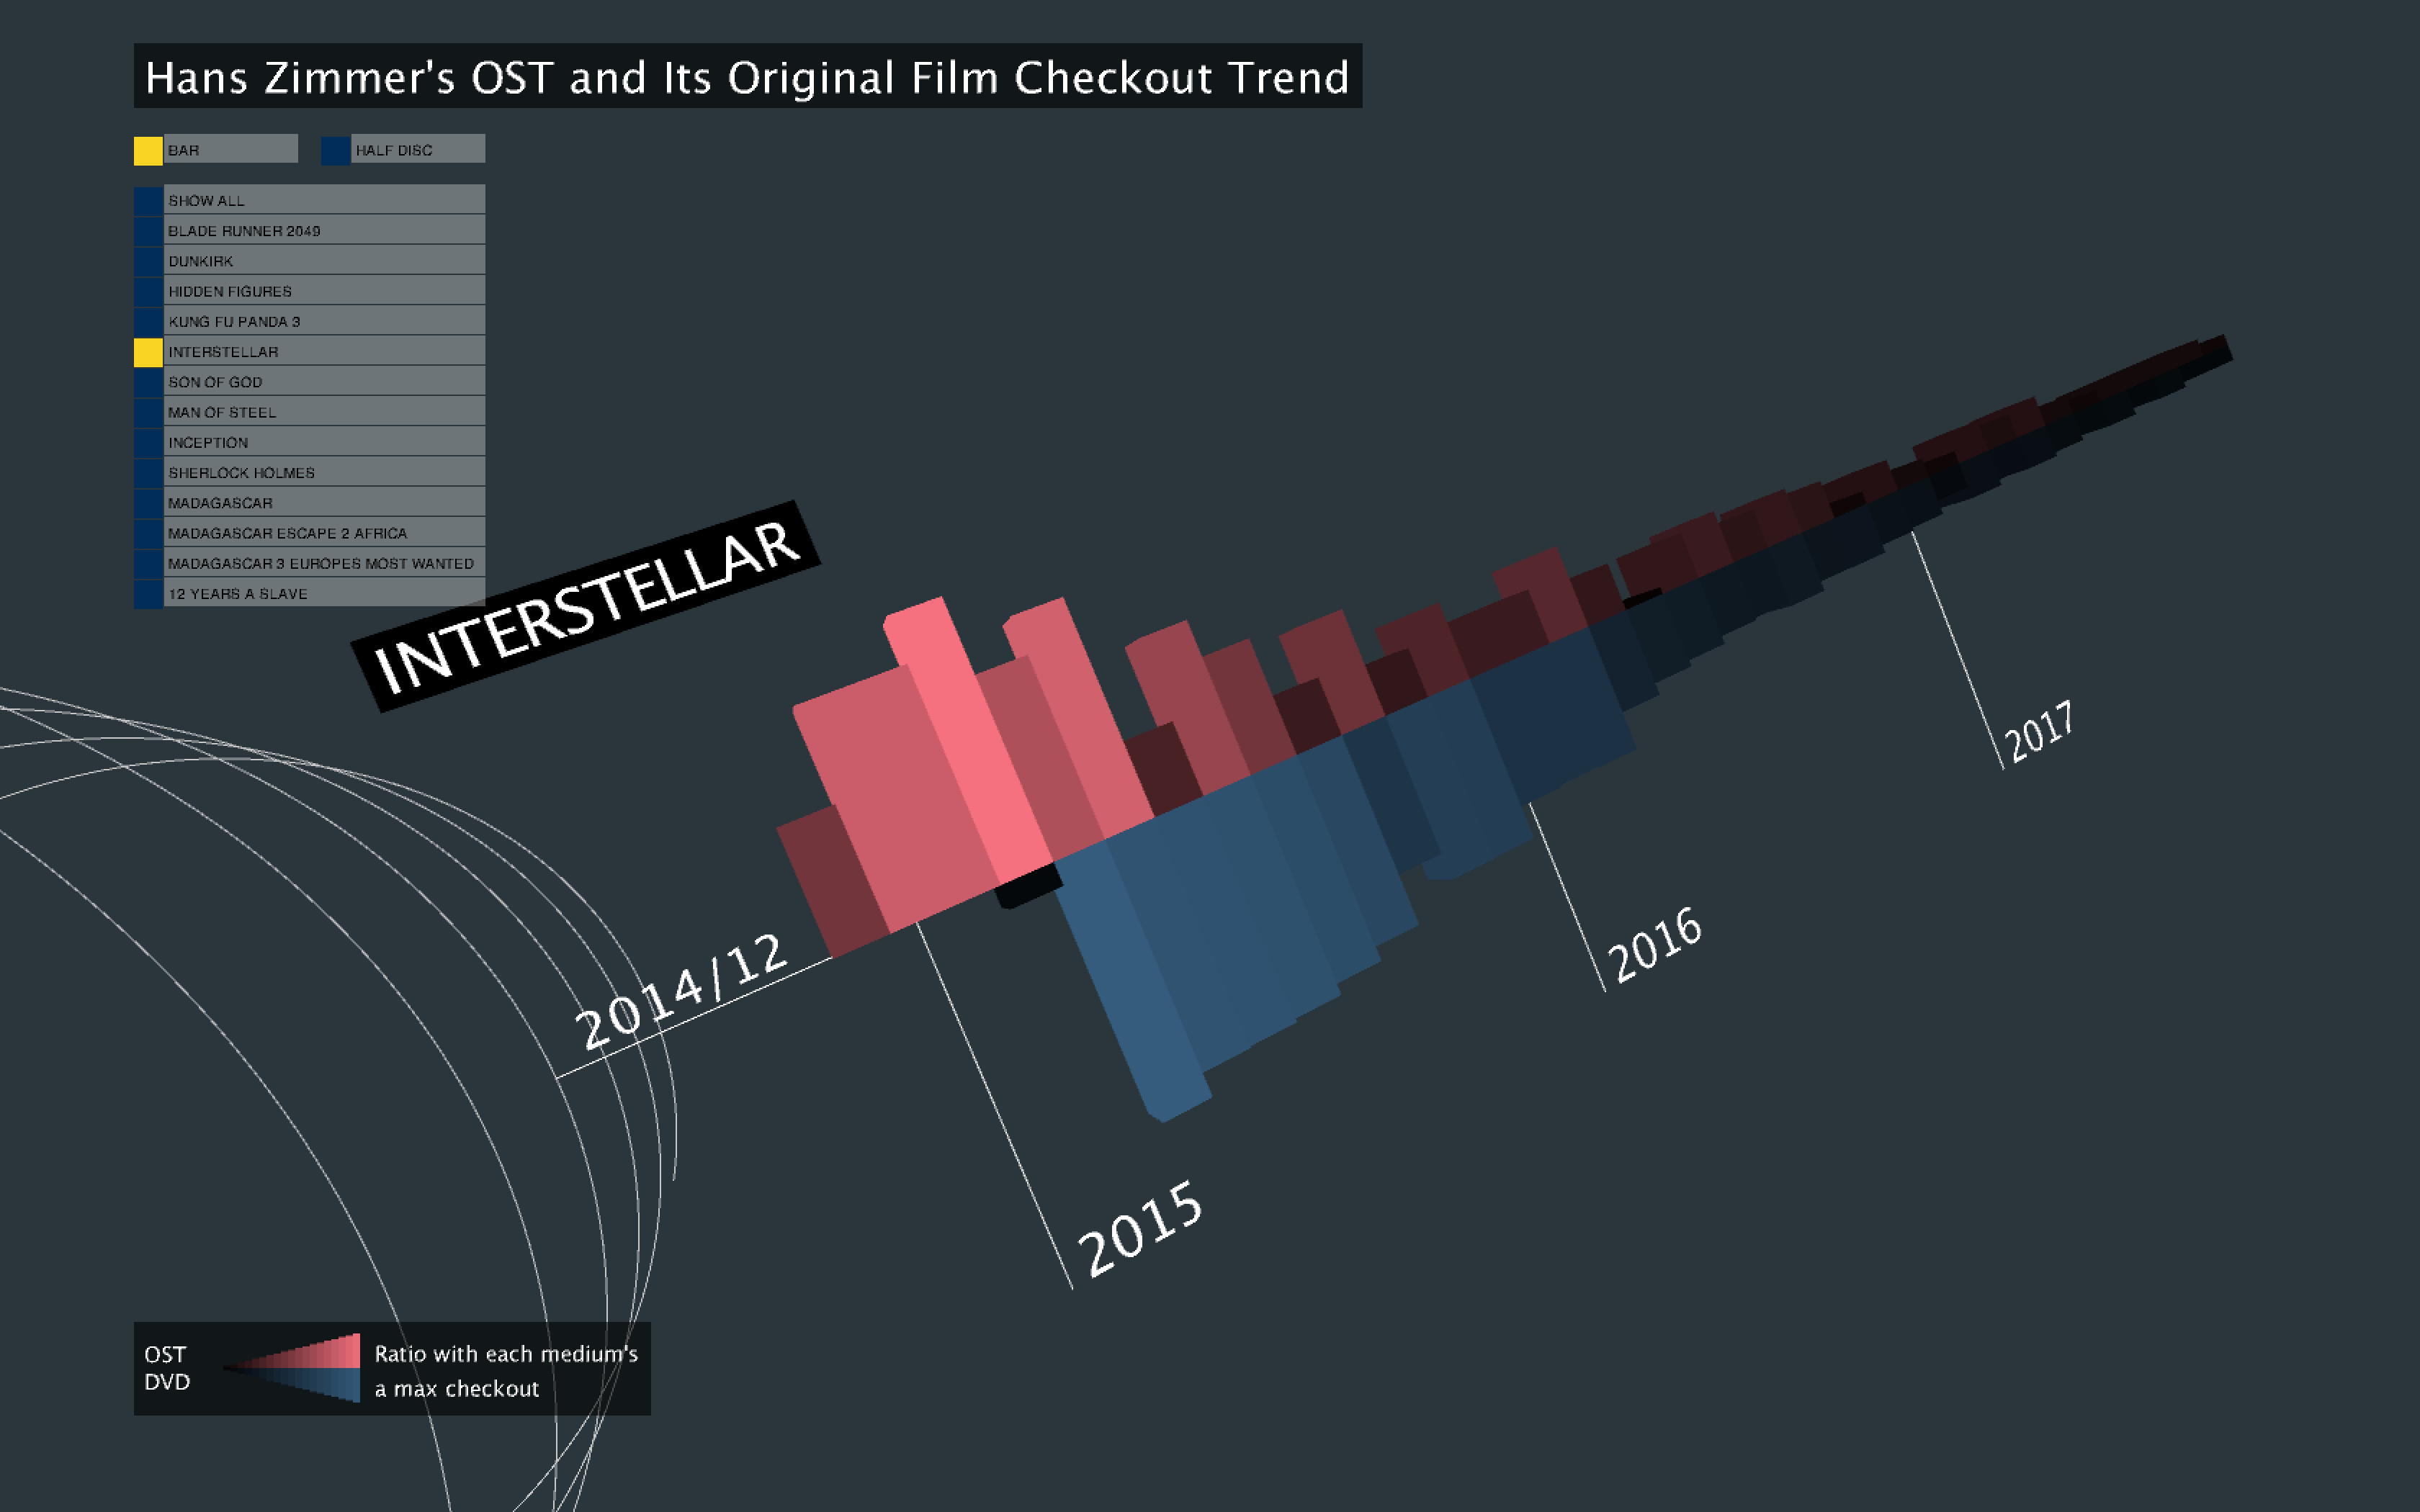
3D Visualization Idea Sketch
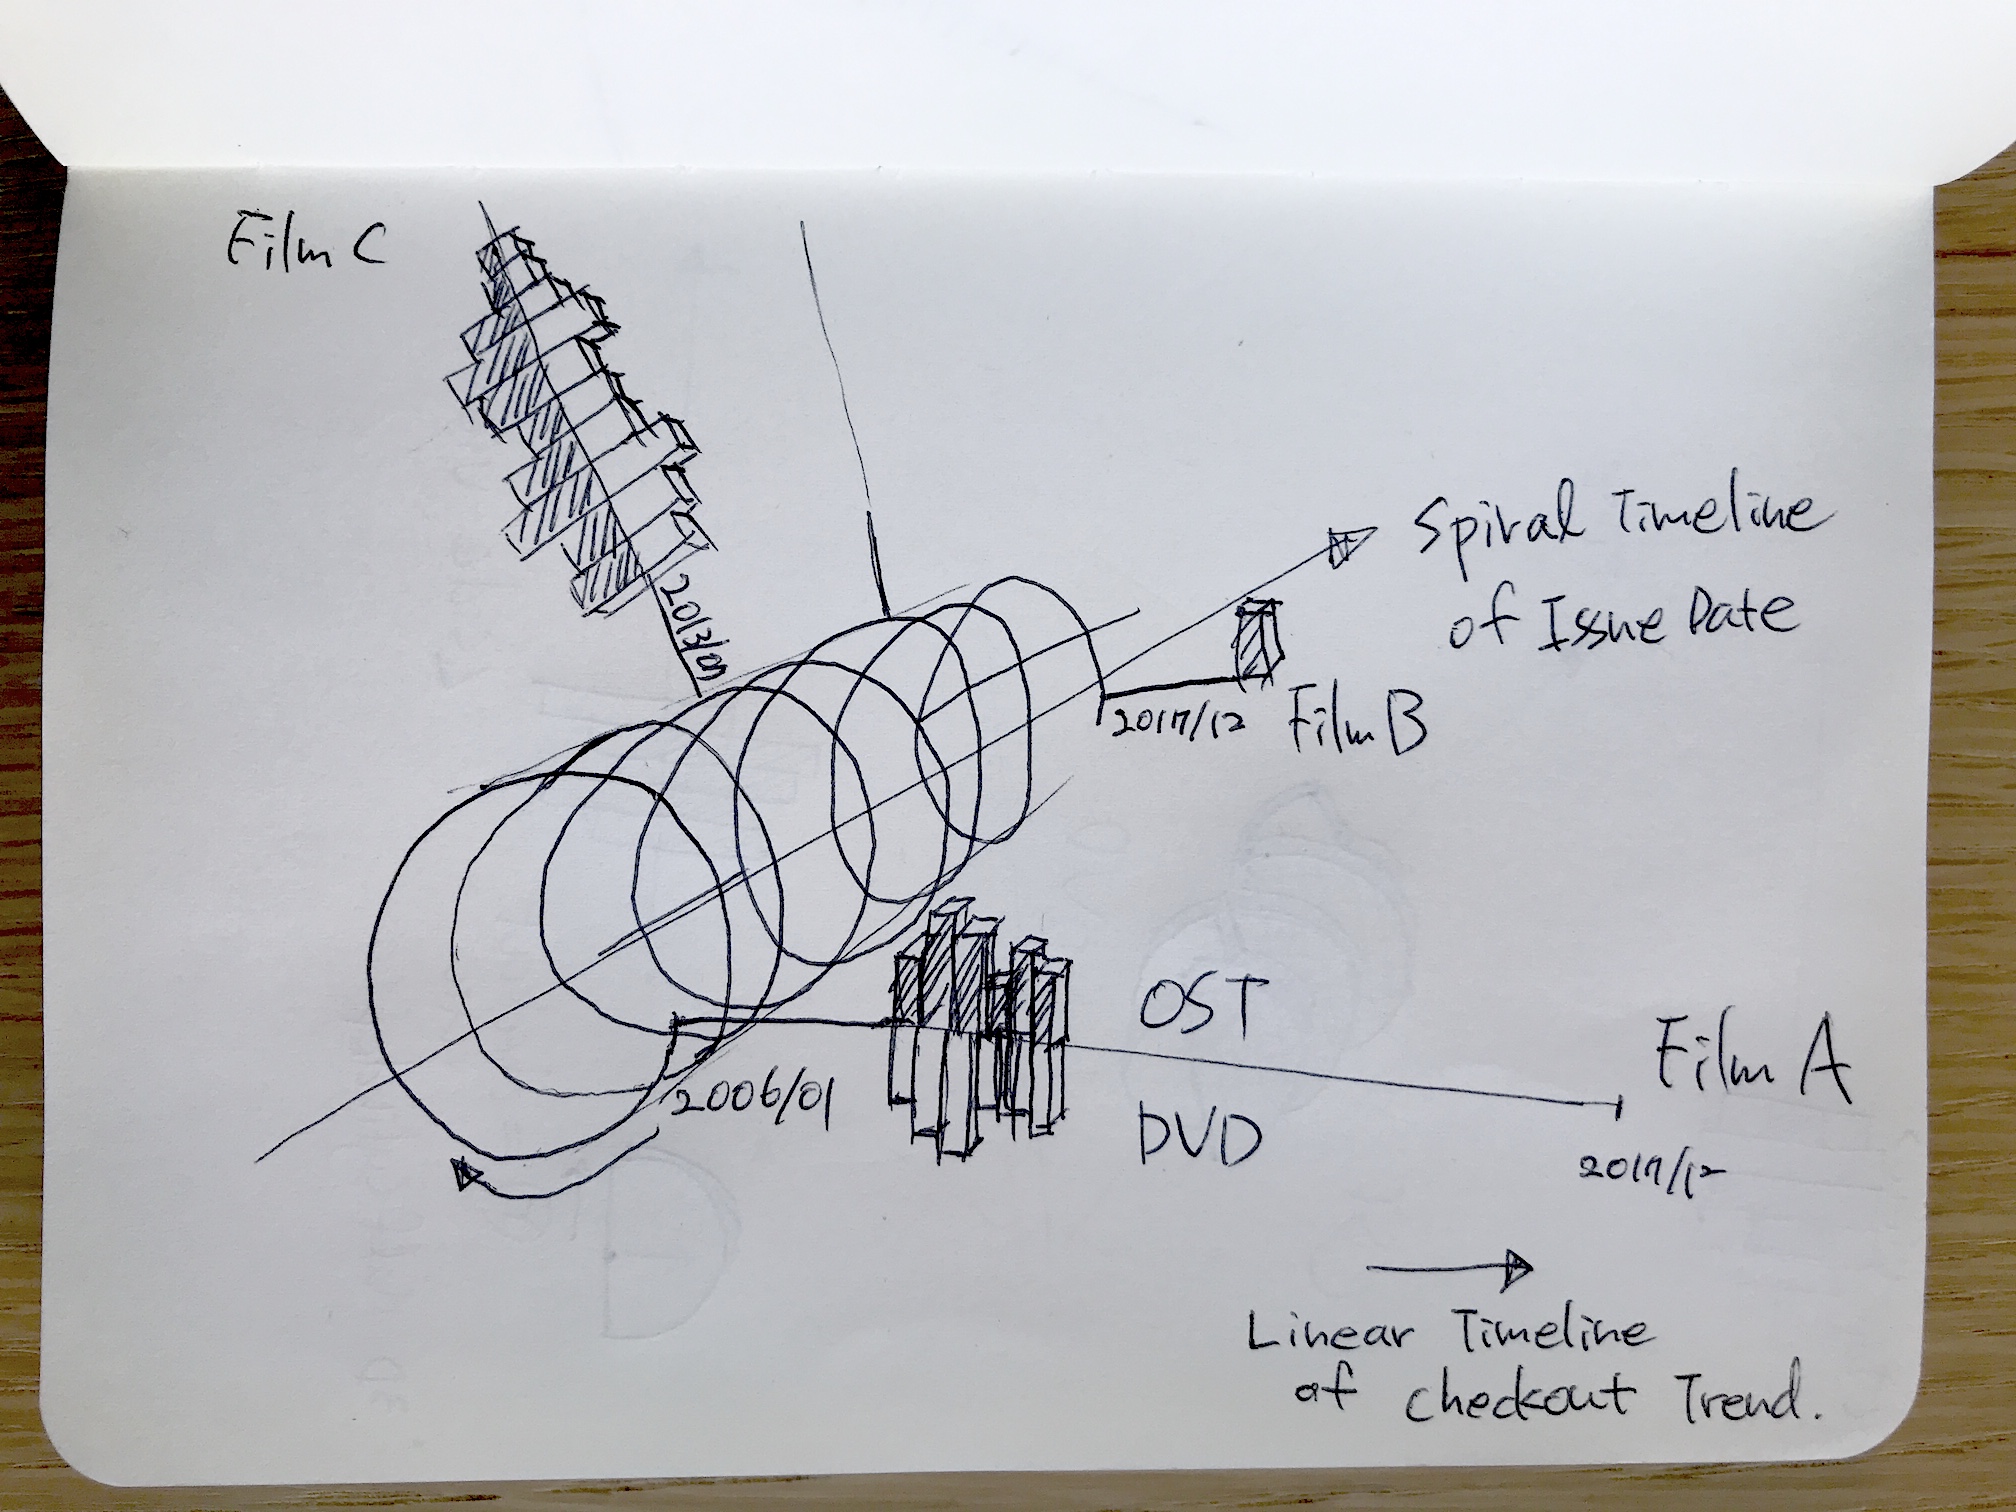
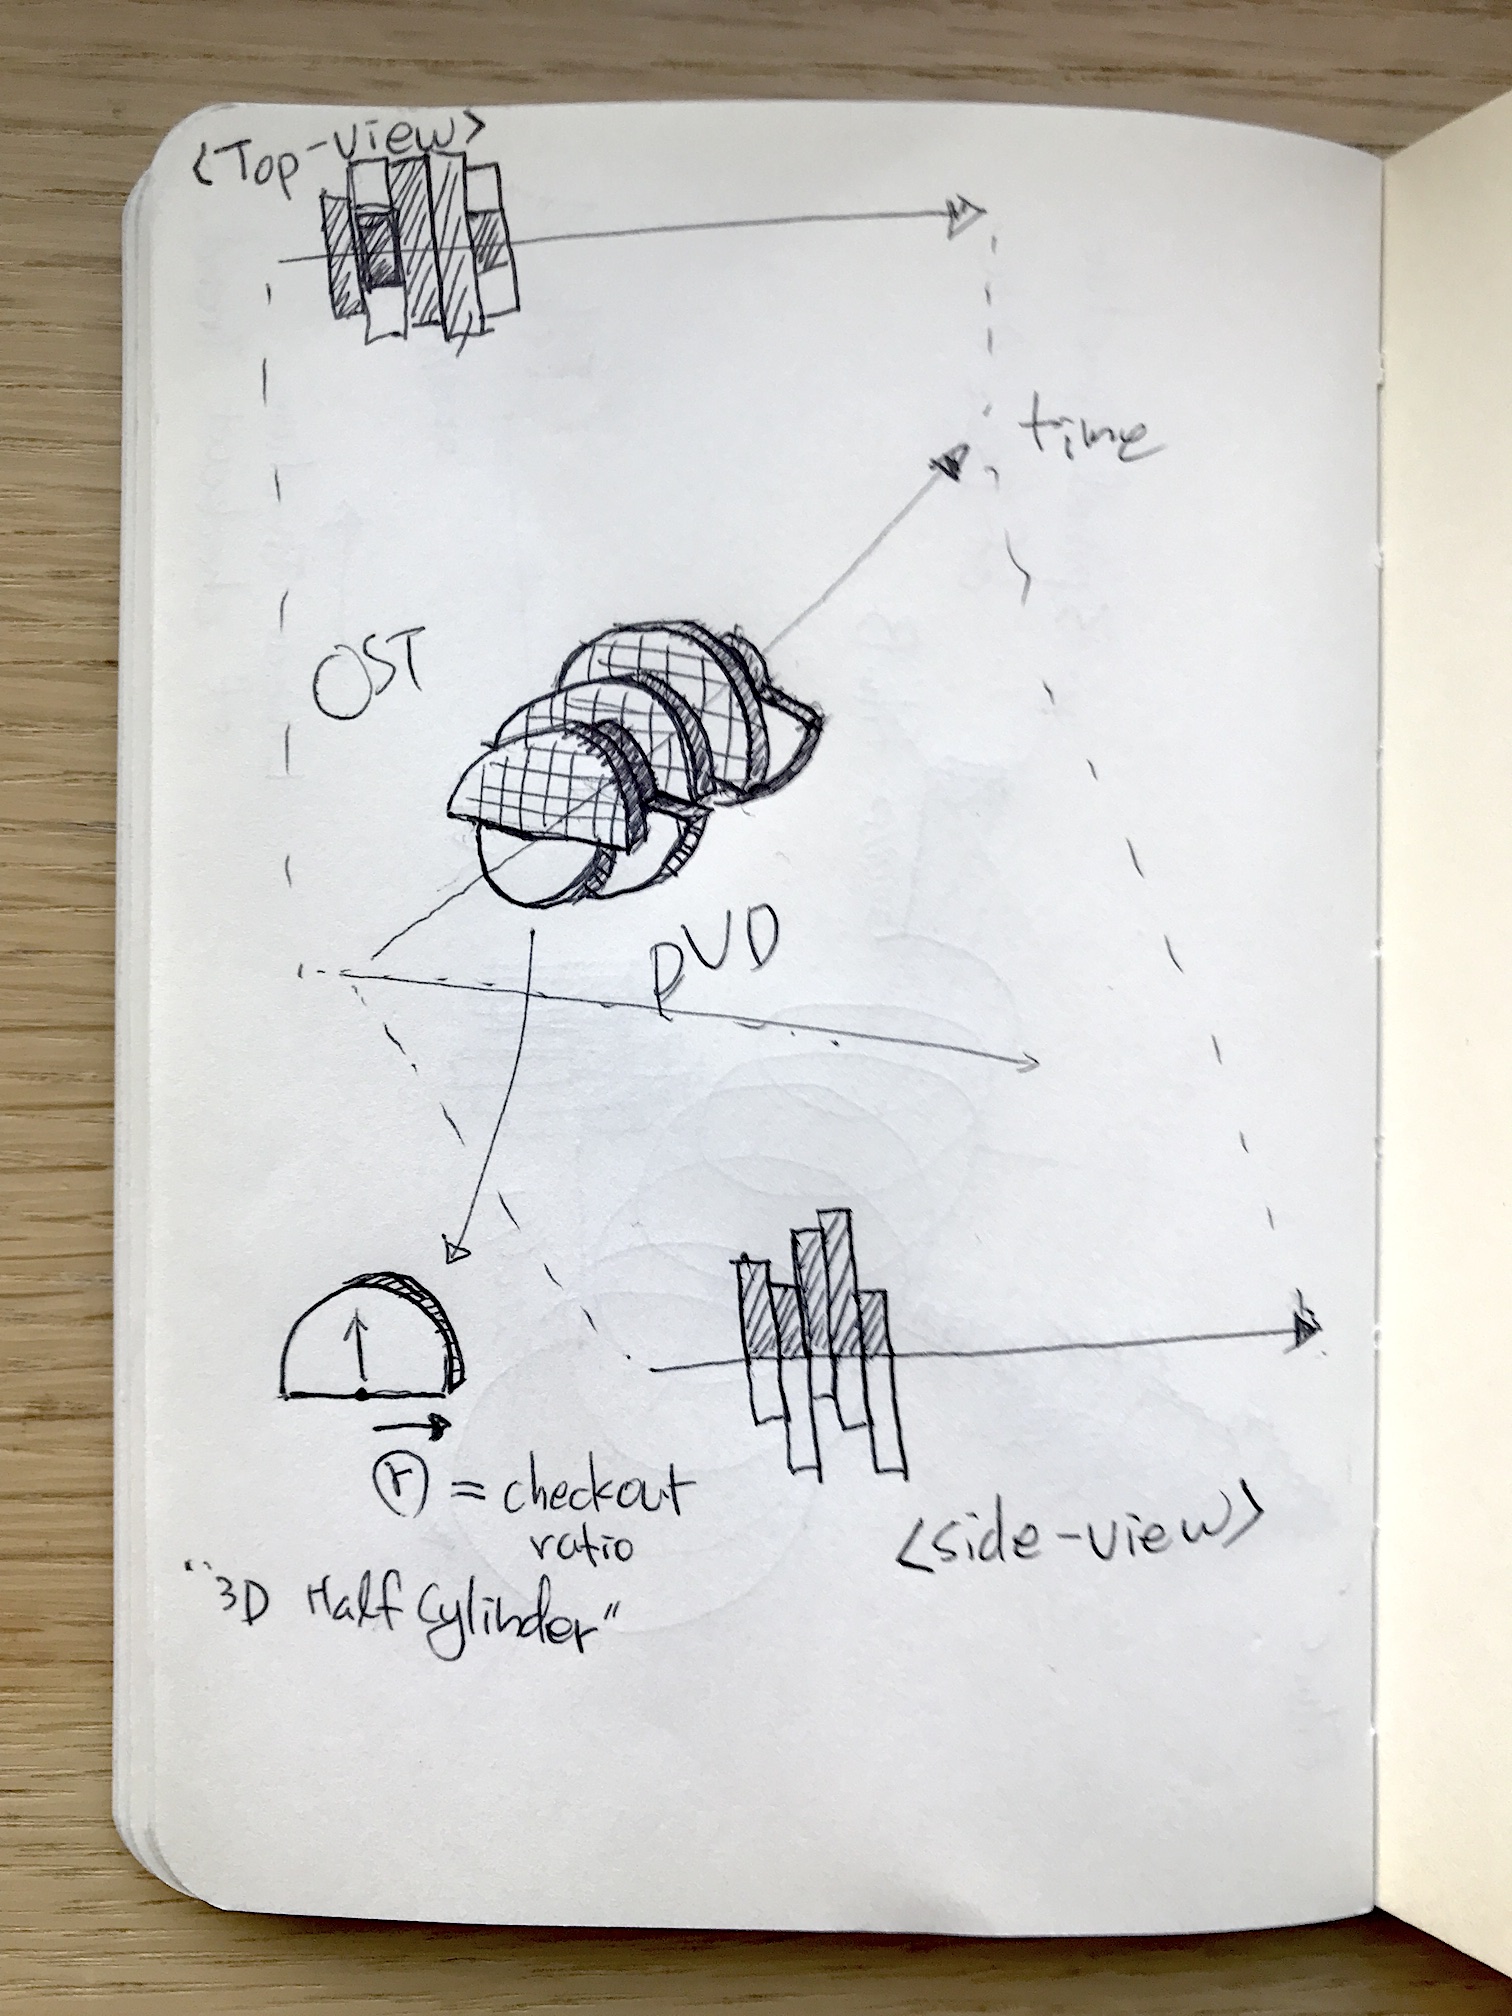
Instead of using a circular timeline for showing an issue date of each item, it draws a 3D spiral timeline at the center. Moreover, it uses not only 3D bars but also 3D half-disc(cylinder) shapes to plot checkout data. What I am expecting in using 3D half-discs is that if a user see a graph from the top or bottom of it, the user can compare the trend of DVD and OST checkouts in a different way that a DVD or OST checkout graph is hidden by the other one at some point thereby understanding one is more popular than the hidden one at the moment.
Process
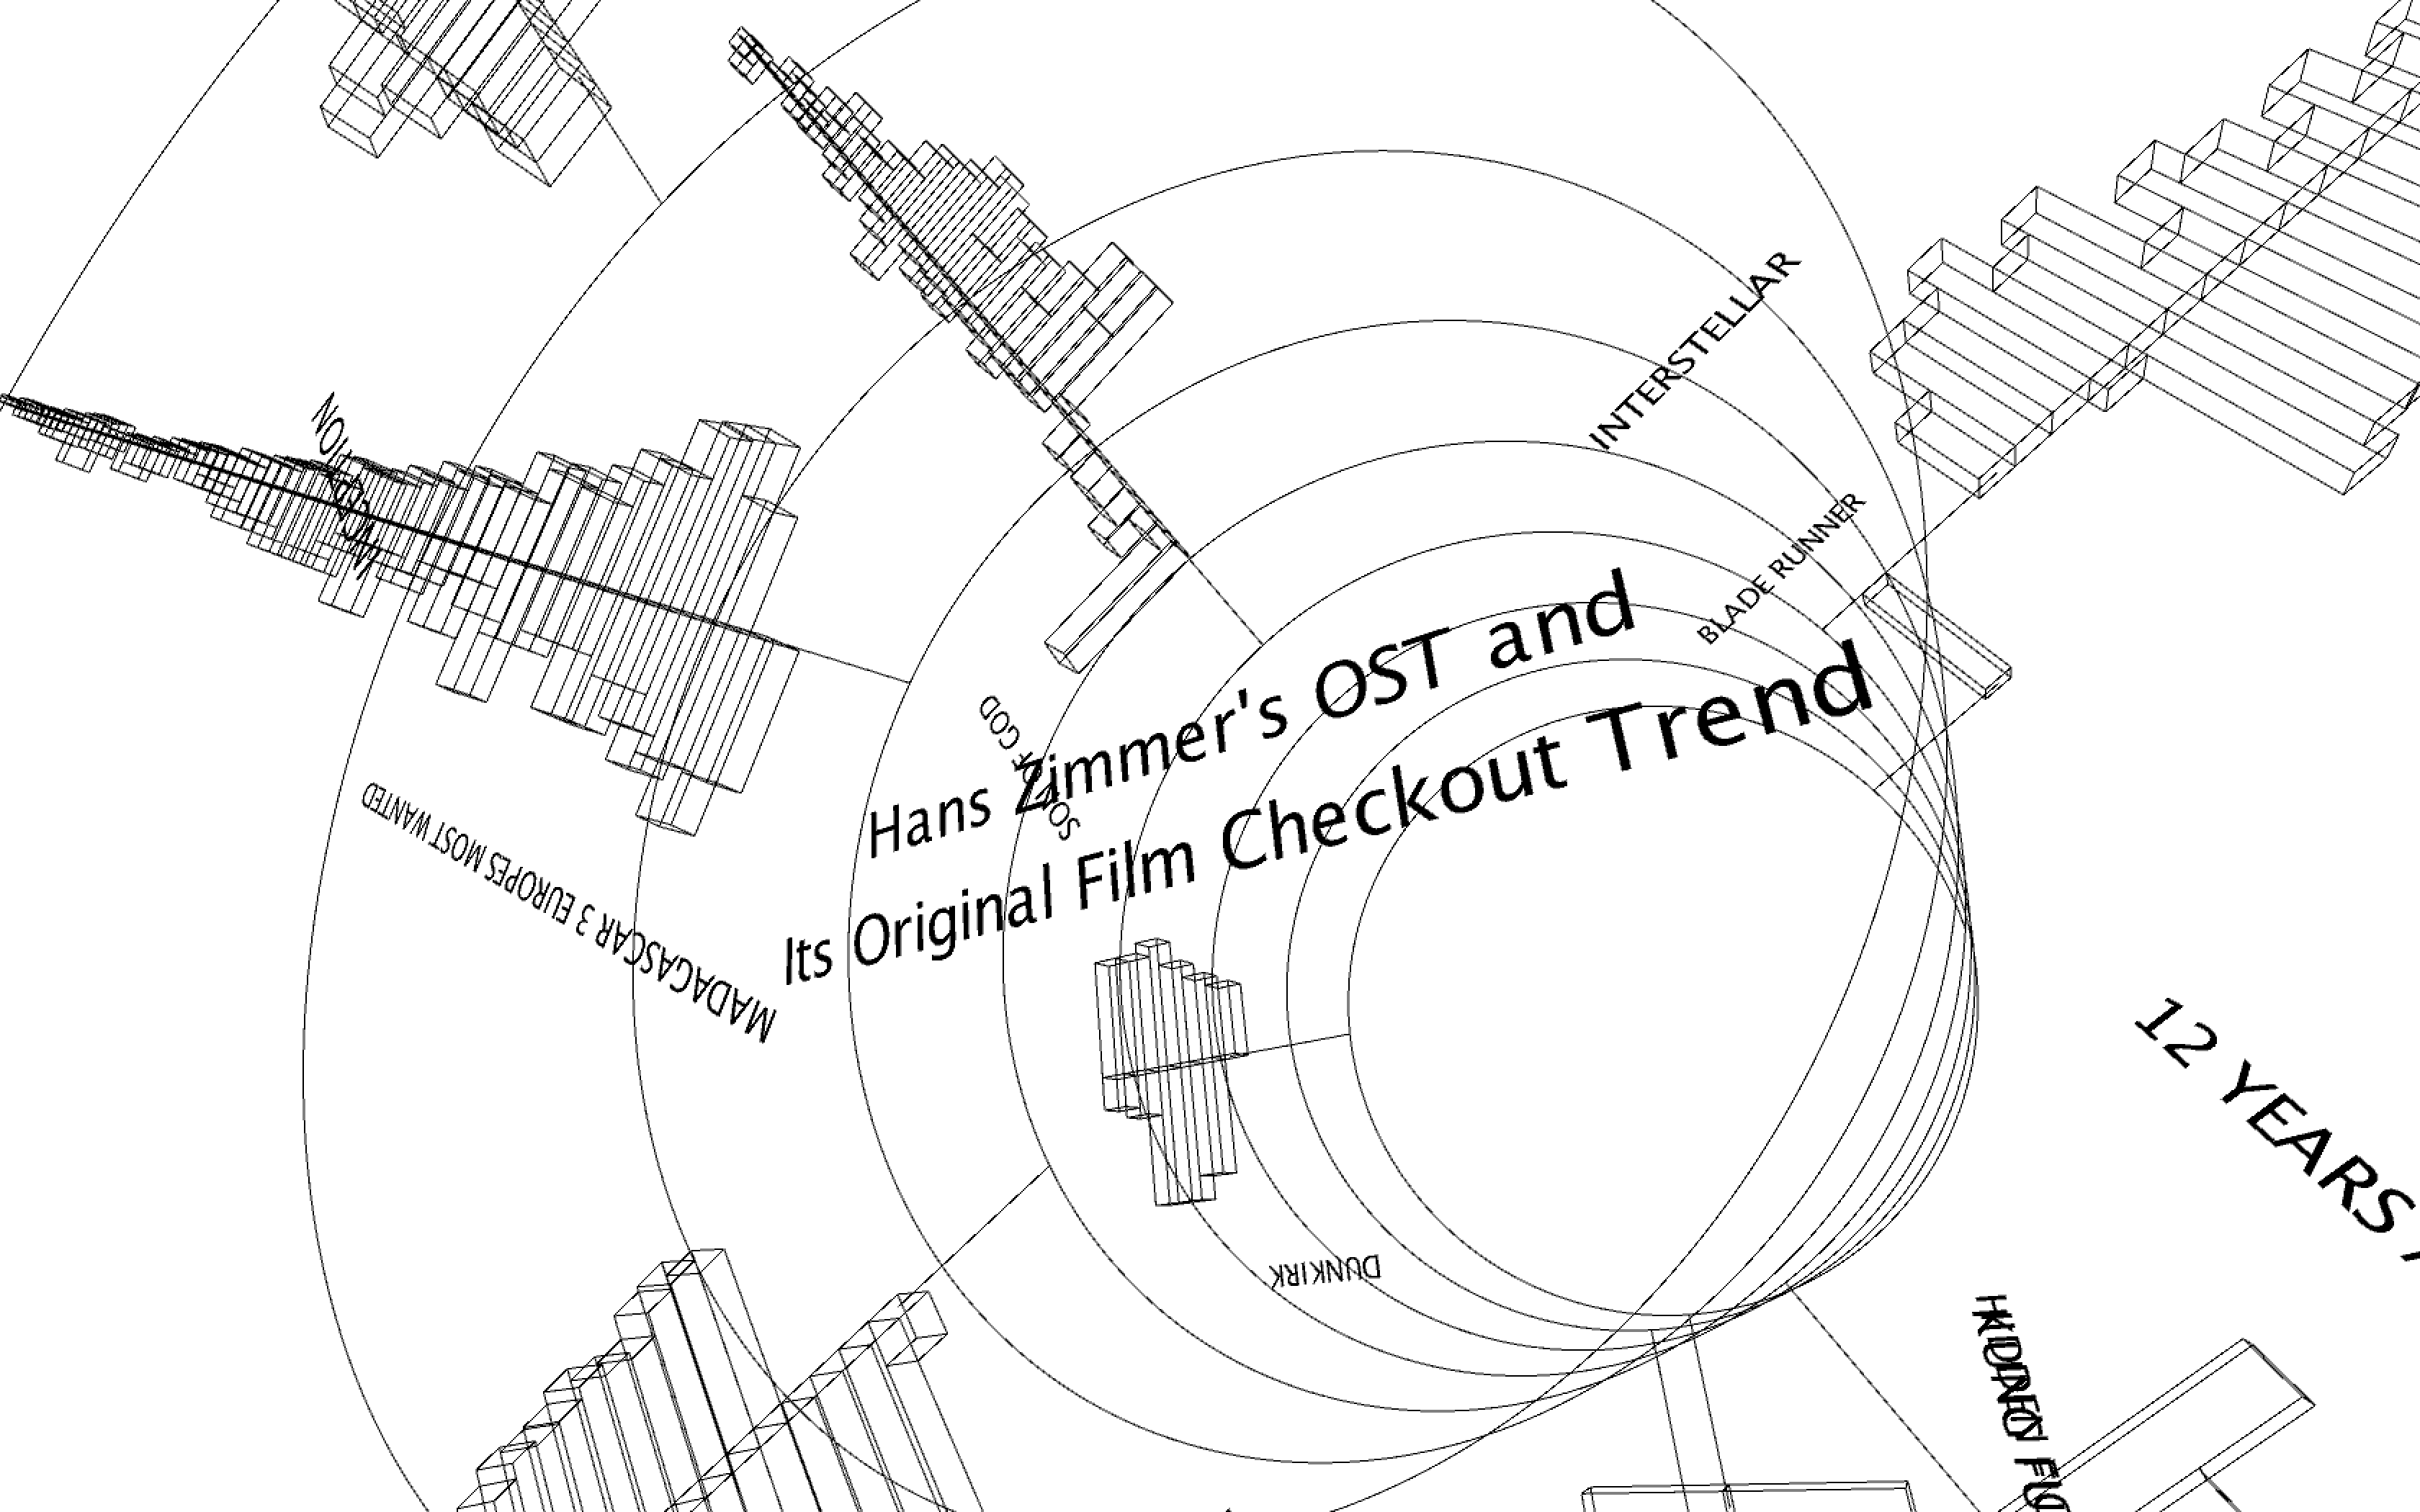
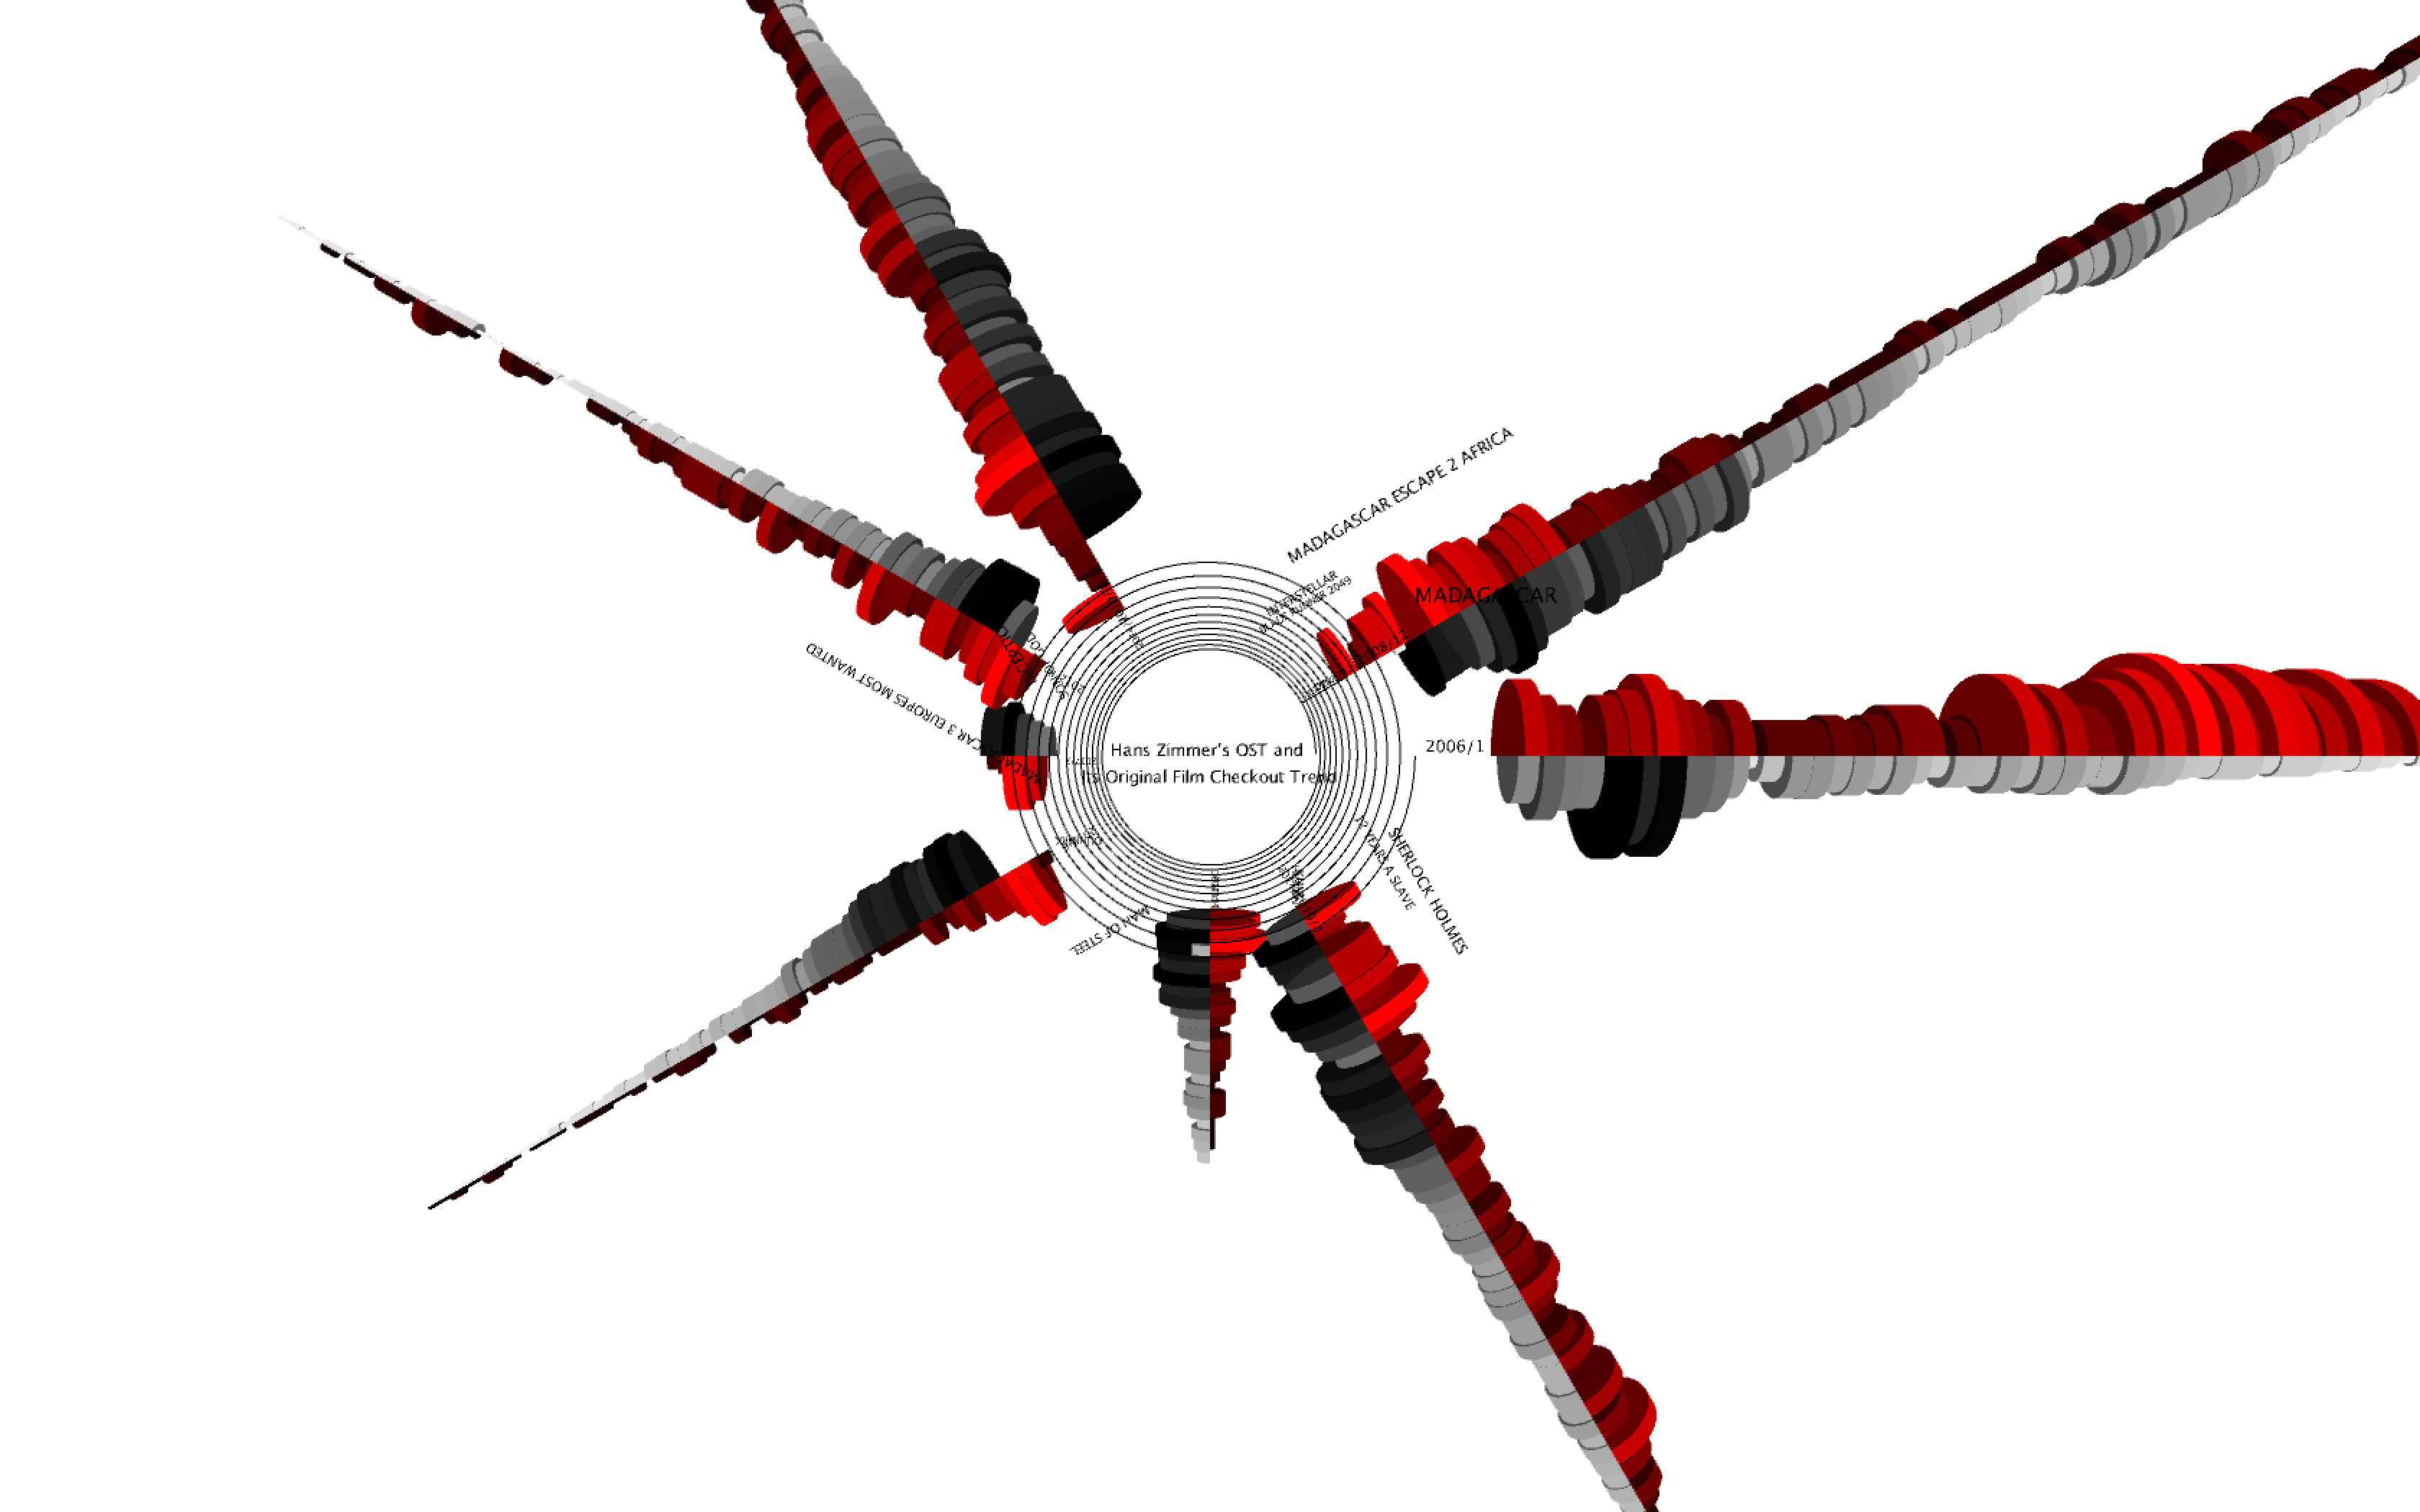
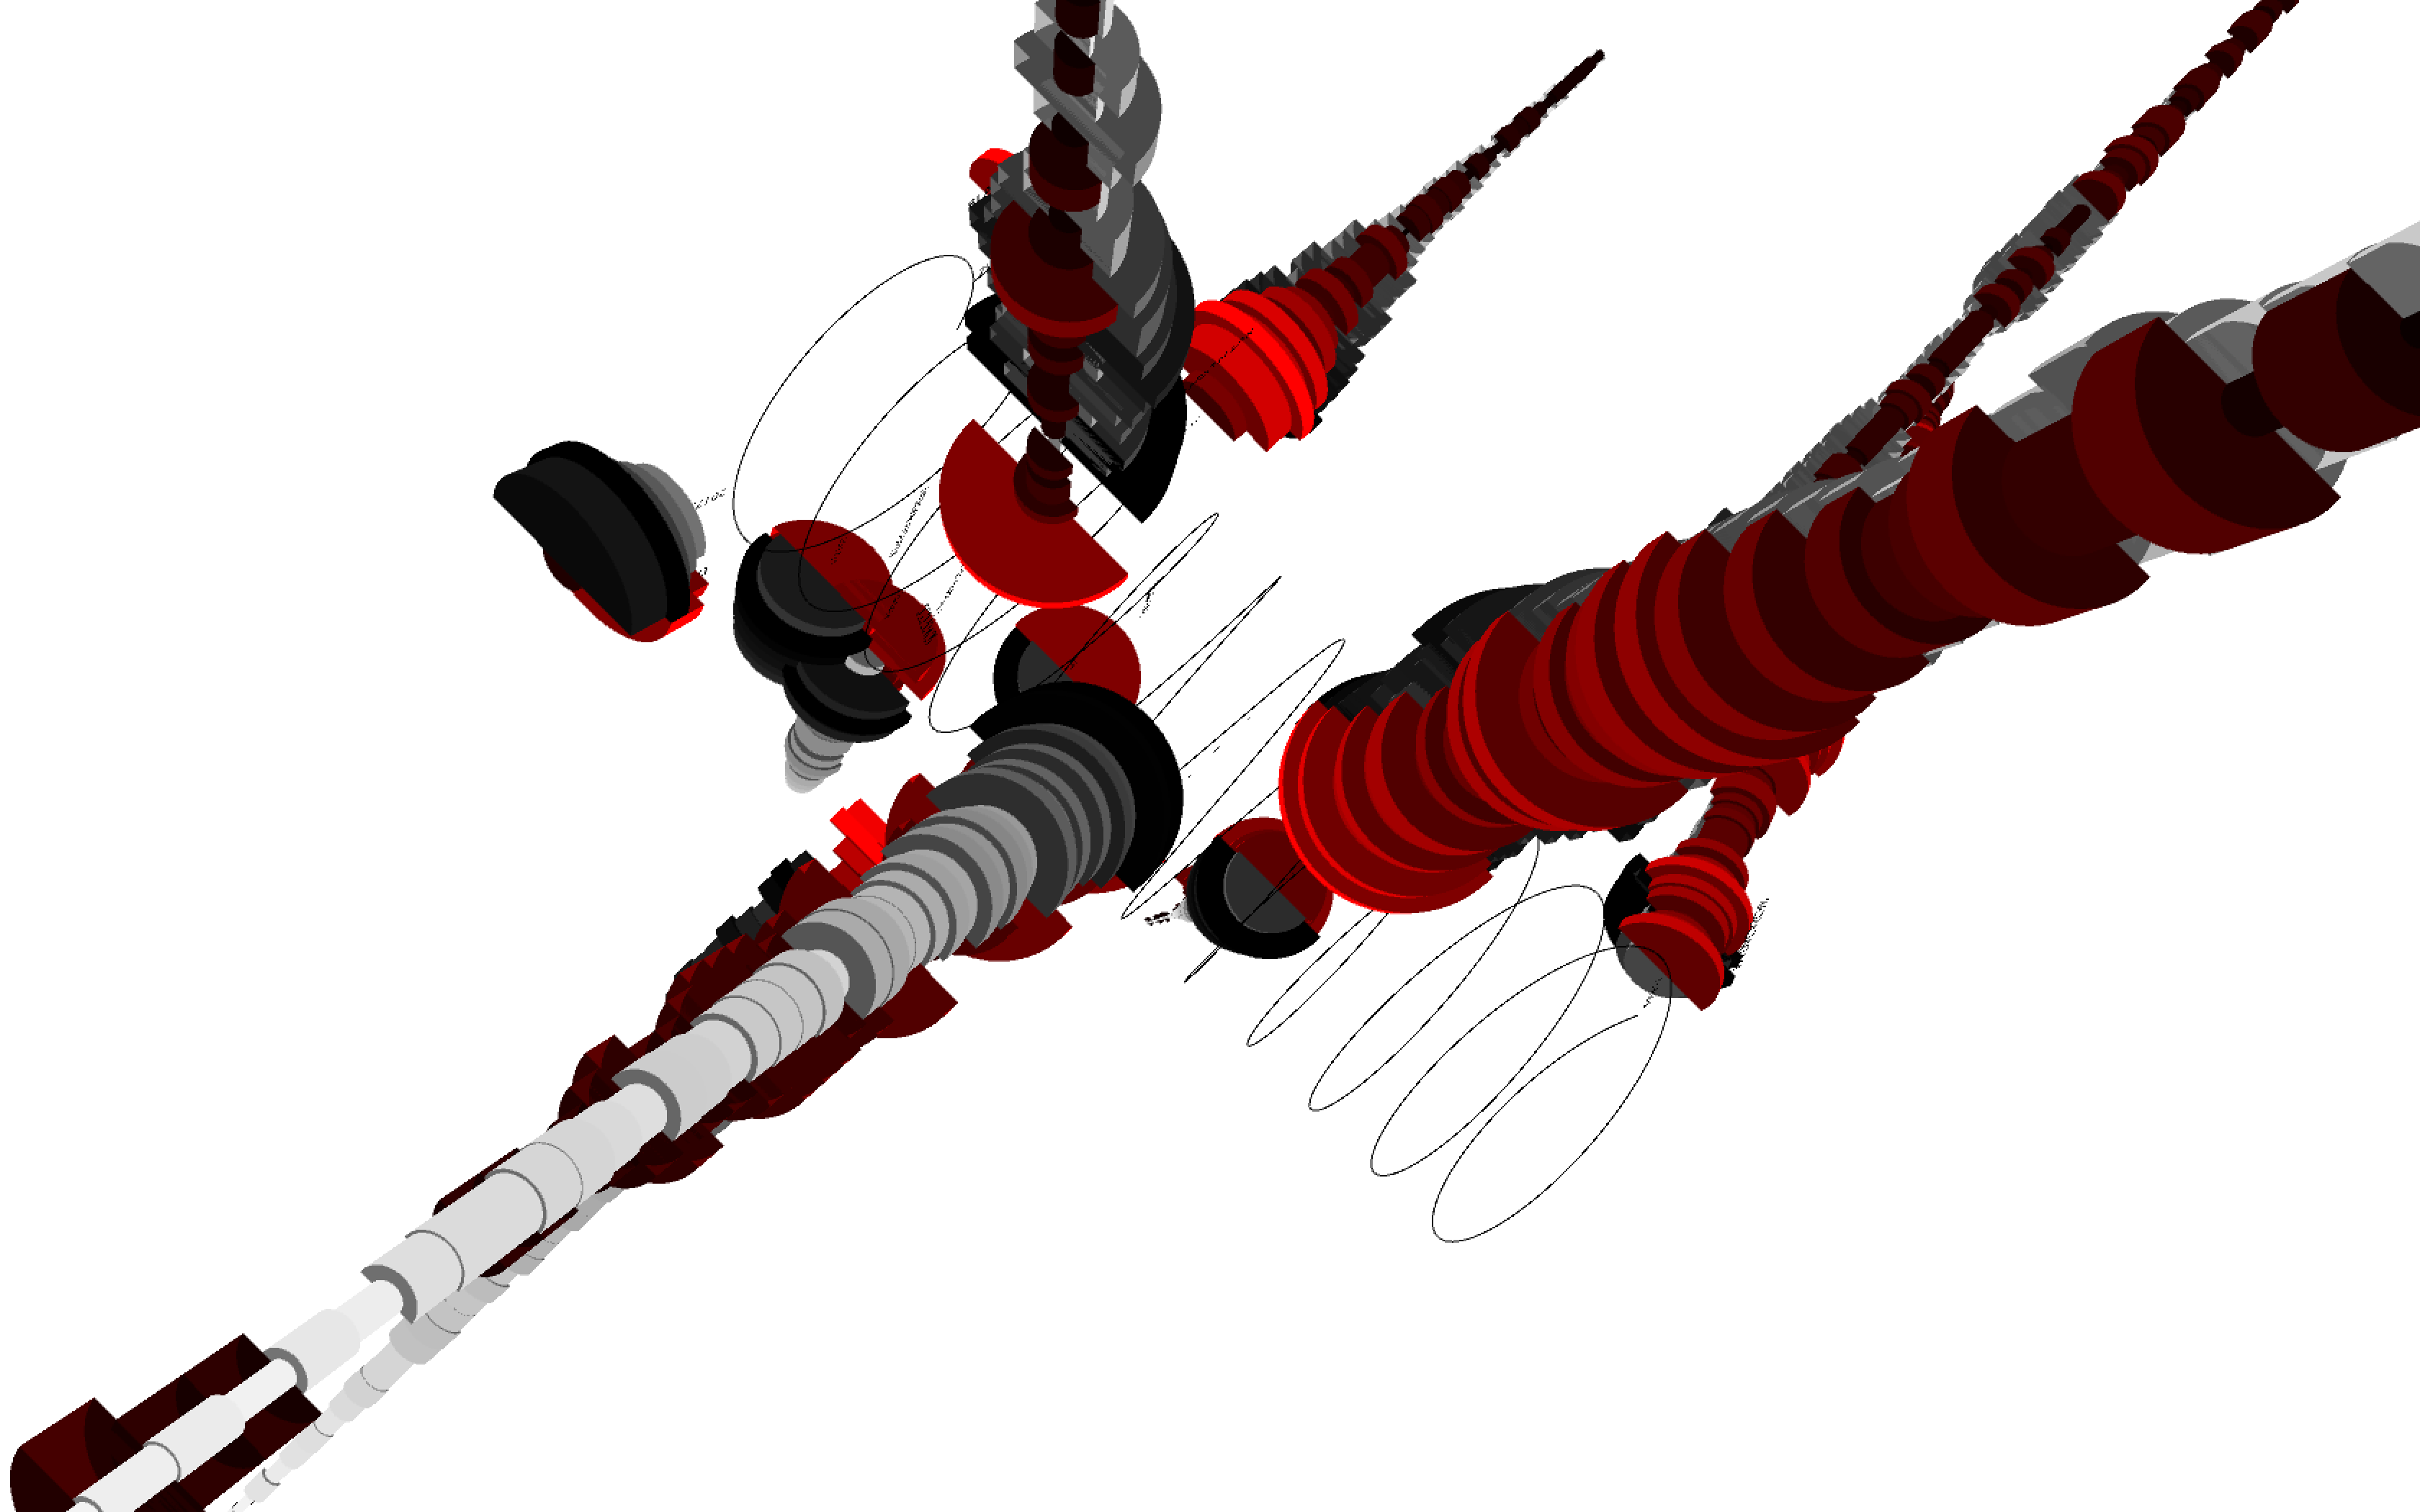
Final Result
Detail description and source code: 2d visualization, 3d visualization