Letter Frequency Visualization
Date: Nov 2019
Categories: Data Visualization, Plotter Drawing, Generative Design
Categories: Data Visualization, Plotter Drawing, Generative Design
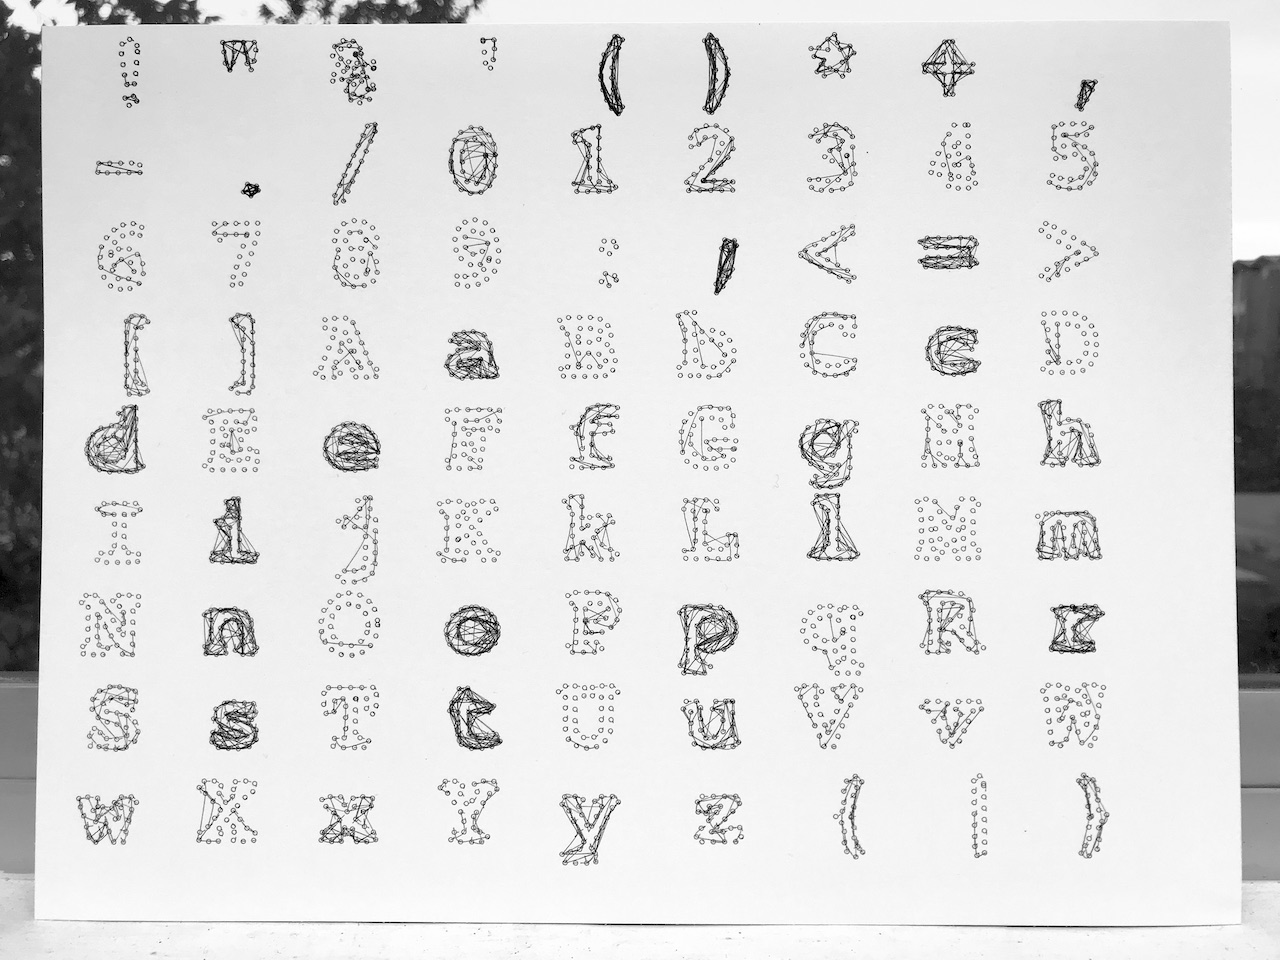
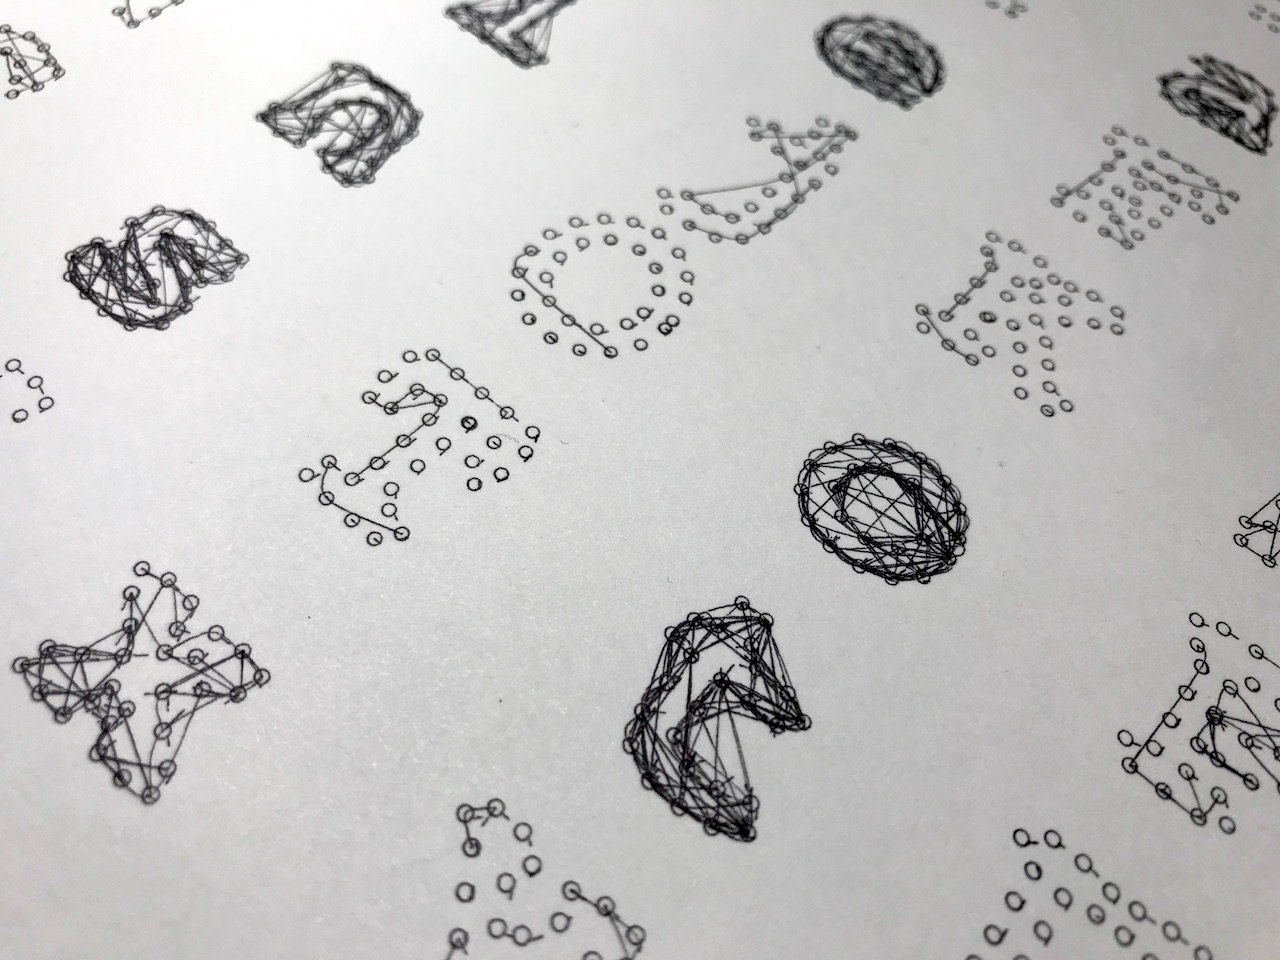
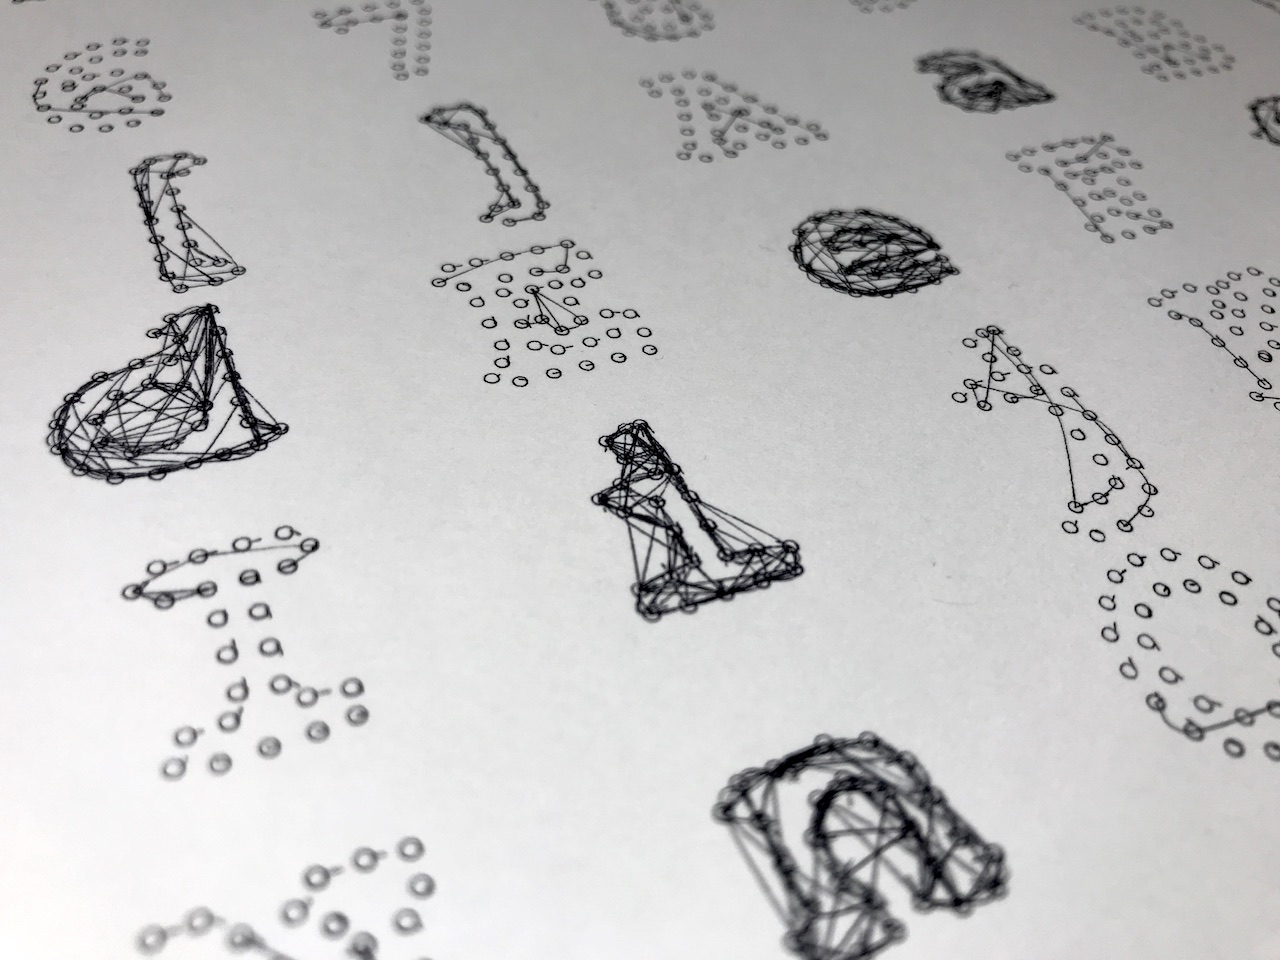
To explore the different possibilities of plotter drawing rather than using pen plotters for abstract or geometric drawings, I made a Processing sketch that reads the source code of the sketch itself, counts the number of each character, and visualizes the letter frequency by drawing lines on the quantized points of letters' contours. The more lines are, the more a character appears in the code. It is a data visualization project creating generative small patterns.


Drawing Process (Timelapse Video)
Acknowledgment
The plotter used for this project was supported by Prof. Jennifer Jacobs in her class “Computational Systems for Visual Art and Design.”